Hi, I see different profilers. The visual profiler, nvprof and nsight. Maybe I am wrong though... I also want to access the performance counters. Which one is suitable for that? What I think is that nvprof is the core and others are some frontends (giu) for that. Am I right?
Hi Mark, I am using as reference your example: nvprof --analysis-metrics -o nbody-analysis.nvprof ./nbody --benchmark -numdevices=2 -i=1, but nvvp is showing only the section "1. CUDA Application Analysis". How can I get the rest of the analysis, sections from 2 to 6?
Hi Mark, My name is Kristoffer. I've been trying to actually re-create nvprof for my own purposes, but I cannot understand how this has been done, and not getting any pointers on the forums..:
https://devtalk.nvidia.com/...
How is it possible to create an executable, that launches another executable, at the same time collecting performance counters on behalf of that process?
Hi,
I ran "nvprof --metric <some_metrics> -o output.%h.%p <cmd>" in linux. When finished, I tried to open the output file in windows. However, when I open the file, it goes to create new session! I have to say, when I do the same steps in linux, the visual profiler opens the file and I can see the data.
Any idea?
Thanks so much Mark. I always find your posts very helpful.
I have a python program (training the neural network). I used "nvprof --export-profile timeline.prof python xxxx.py" to generate the "timeline" that can be imported to the Visual Profiler. And I also used "nvidia-smi --query-gpu=fan.speed,temperature.gpu,power.draw,memory.used,utilization.gpu --format=csv,nounits --id=2 --loop-ms=2 --filename=xxxx.csv" to collect the status of the GPU during the execution of xxxx.py. But when I import the timeline into the Visual profiler, the duration of the xxxx.py (20s) is different with the actual execution time. Does nvprof will affect the execution time of the xxxx.py?
Yes, enabling profiling does have an impact on kernel execution time, due to the instrumentation of the kernel the profiler must do. The magnitude of the impact depends on what settings (e.g. whether you are just collecting timeline vs. kernel metrics) you have enabled.
Is there any way to collect the power consumption data of GPU that coordinates to the collected timeline? In current stage, I can only collect the power data and the timeline (or metrics) respectively.
This is a few years old but it may be helpful: https://devblogs.nvidia.com...
I have tried to collect the power of GPU via "nvprof --system-profiling on --export-profile timeline.prof python xxxx.py". And actually, the power data has been collected. I realized two problems:
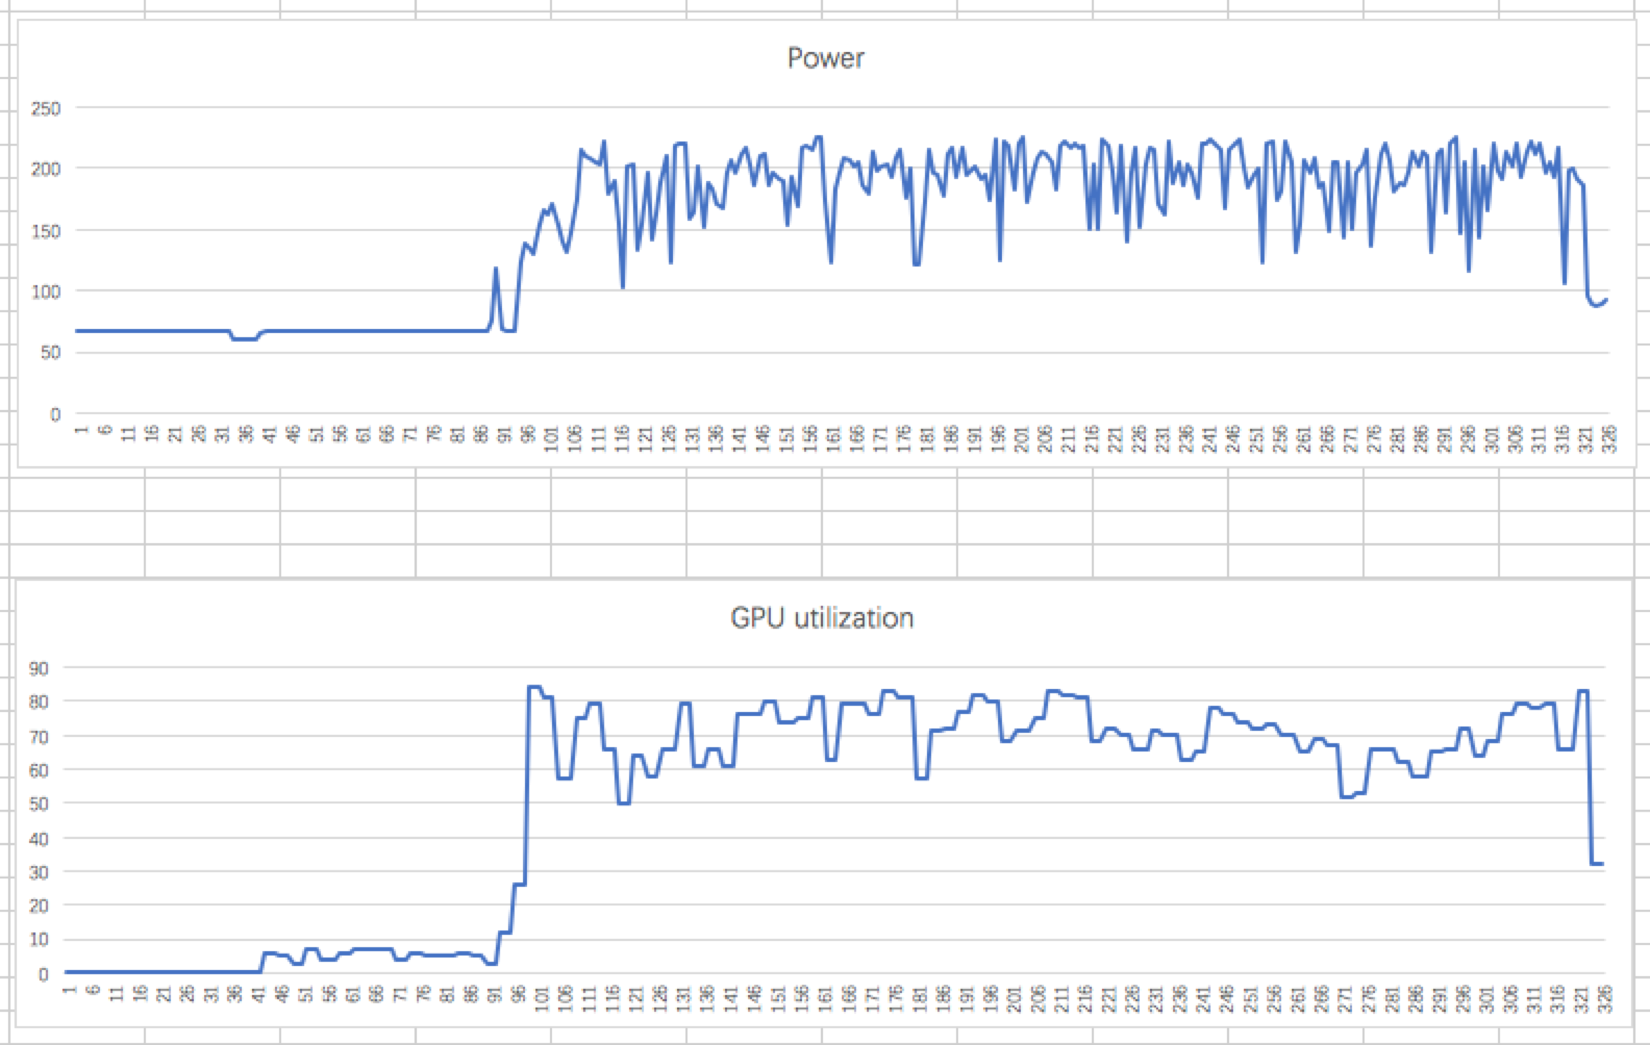
1. I have ran "nvprof --system-profiling ......python xxxx.py" and "python xxxx.py" on the same GPU, respectively. Concurrently, I have also collected the power of GPU for the two cases via "nvidia-smi". I found that the execution time, GPU power, and GPU utilization are totally different as shown below. What is the reason?
* power and utilization curves of "python xxxx/py"
https://uploads.disquscdn.c...
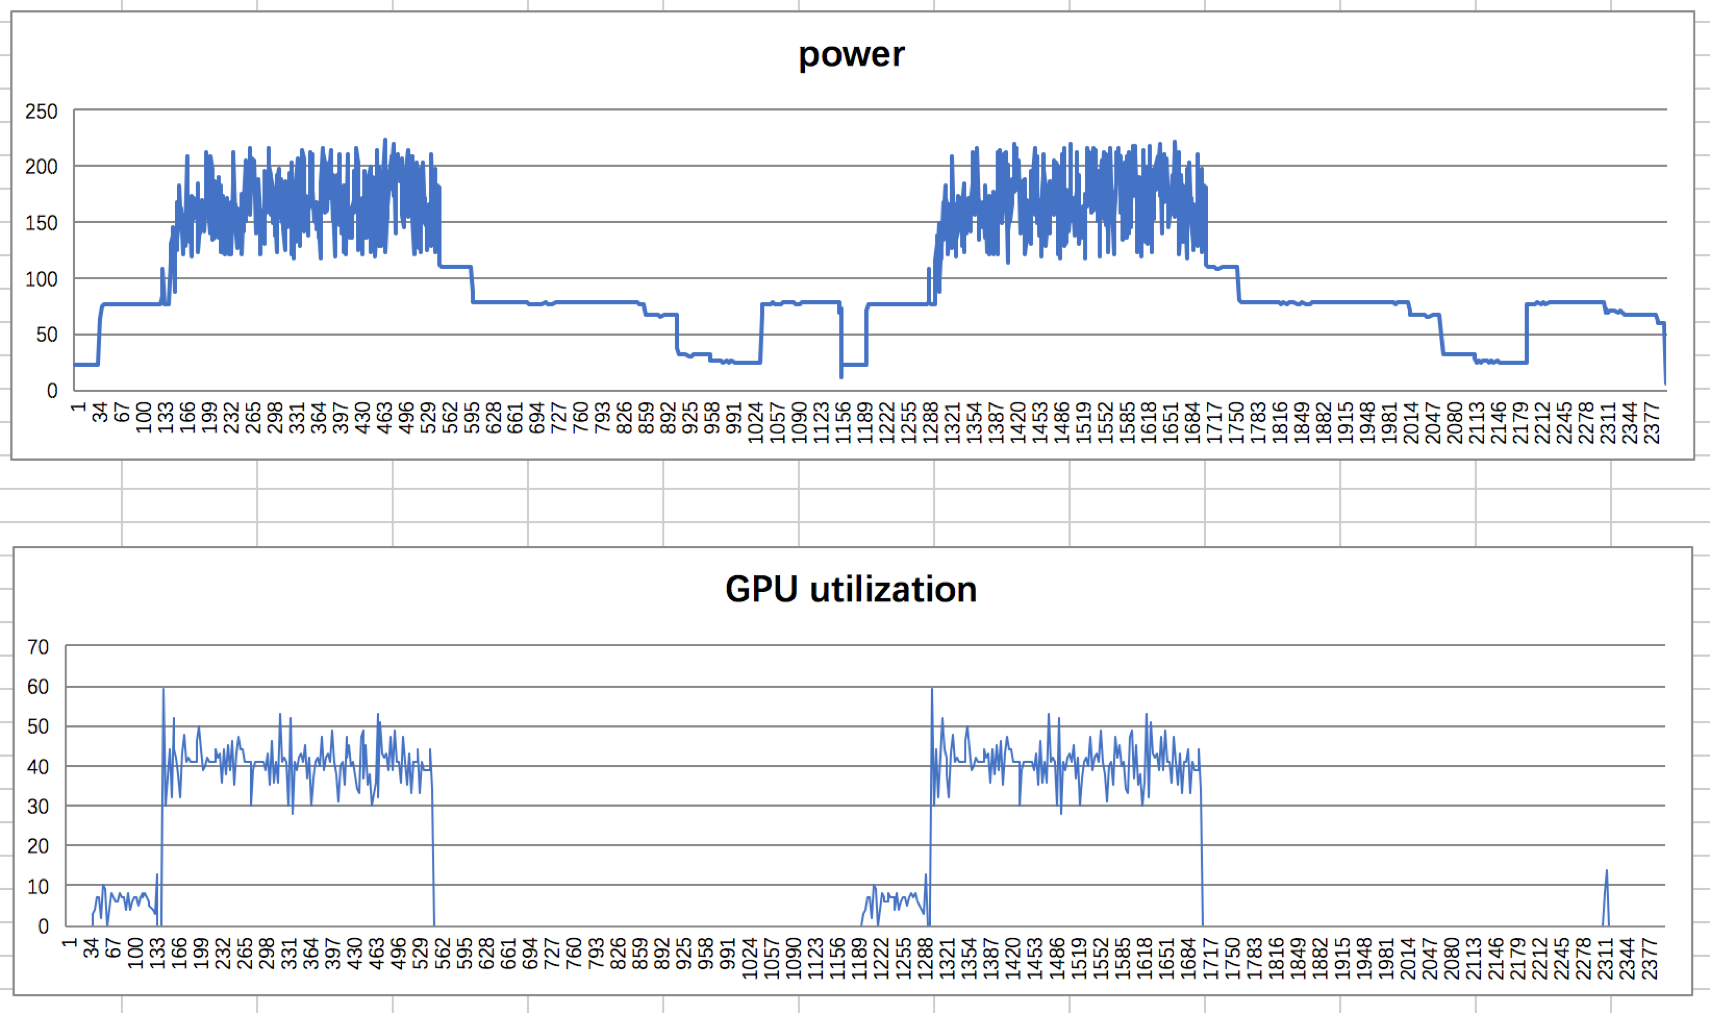
* power and utilization curves of "nvprof --system-profiling ... python xxxx.py"
https://uploads.disquscdn.c...
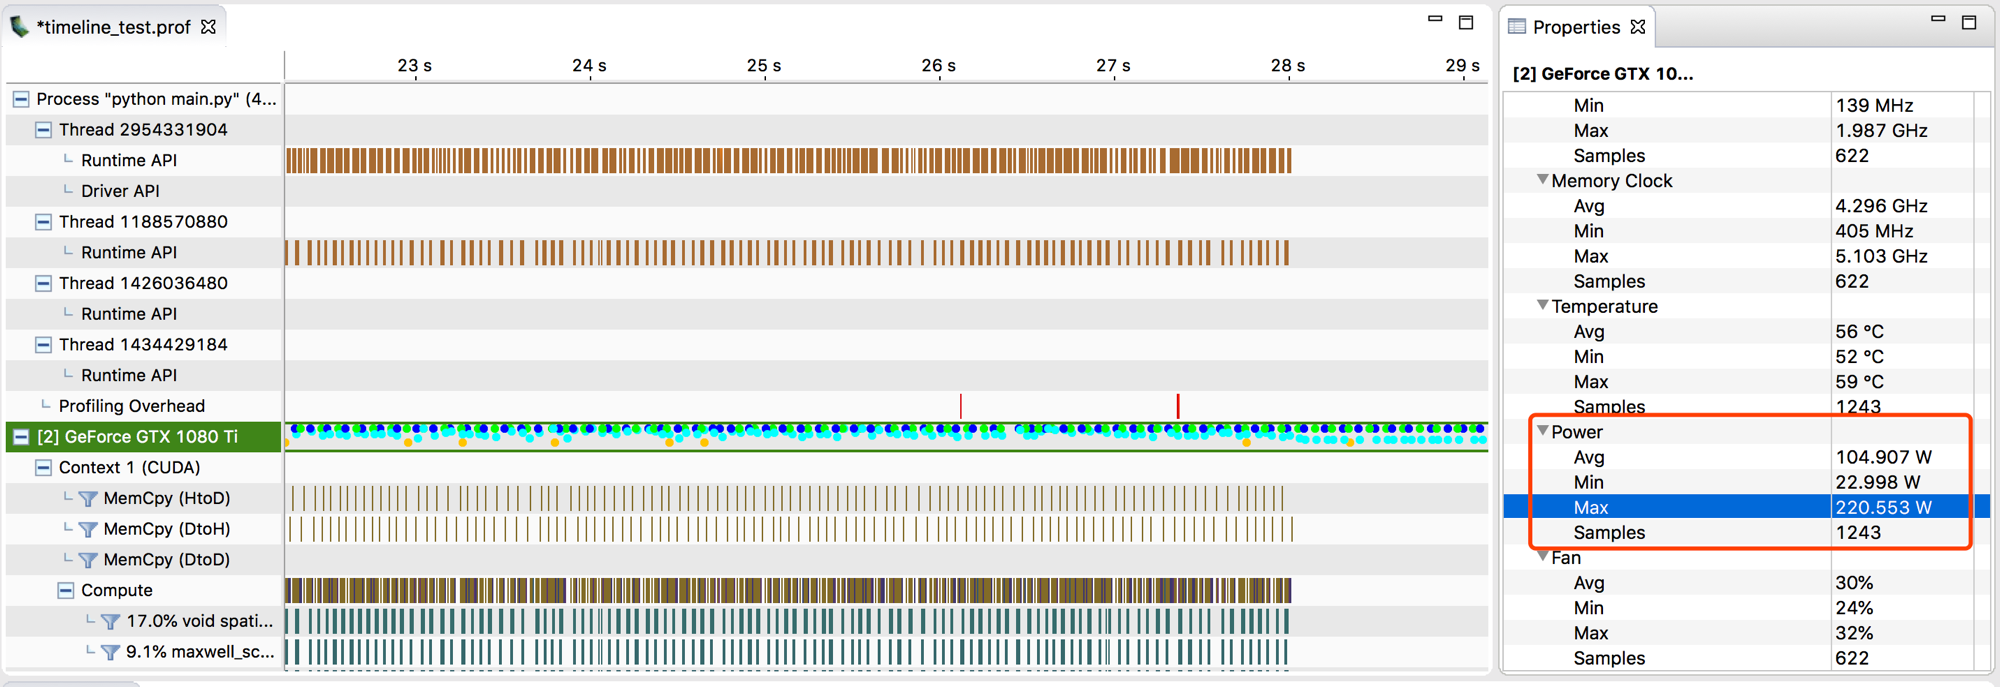
2. Based on the generated timeline.prof (with power, utilization, etc.), I import the timeline into visual profiler as shown below. The average, min, and max power during the duration are collected. However, I cannot export all "1243" samples of the power consumption. Is there any way for exporting all the samples?
https://uploads.disquscdn.c...
I am trying to profile a file and it is only showing the CUDA memcpy DtoH in the kernels. None other kernels are mentioned, what could be the reason for this? How do I resolve this?
Are you sure there are actually kernels running? If not, that would explain why there are none in the profile. Often this is a sign that you aren't properly checking for errors.
Yes, I accidentally exceeded the memory, which I later realized. Thank you.
Thank you for useful information :-)
Hello, iam having problem on viewing the visual profiler. Every time it open upon selecting a file it returns a error, saying "The application being profilled returned a non-zero code". Using python as a language
1 Like
Hey George! It is cool to talk to the guy who coined GPGPU.
What is the general overhead of nvprof? 1%? 10%?