CudaMalloc slow on DriveAGX

We were experiencing lower than expected performance on our DriveAGX Pegasus, running DriveOS 10. When analyzing our application using “nvprof” could identify calls to ‘cudaMalloc’, allocating memory for the iGPU, as one of the problems. I wrote a small test program:

#include <chrono>
#include <iostream>
#include <cuda.h>

int main (int argc, char** argv){
    int n = 1000;
    unsigned sizeX = 1920u;
    unsigned sizeY = 1208u;
    cudaSetDevice(1);

    float *in;
    cudaMalloc(&in, sizeX*sizeY*sizeof(float));

    auto start = std::chrono::high_resolution_clock::now();
    double tMalloc = 0.0, tCopy = 0.0, tFree = 0.0;
    for(int i = 0; i < n; ++i) {
        float* tmp;

        auto t0 = std::chrono::high_resolution_clock::now();

        cudaMalloc(&tmp, sizeX*sizeY*sizeof(float));

        auto t1 = std::chrono::high_resolution_clock::now();

        cudaMemcpy(tmp, in, sizeX*sizeY*sizeof(float), cudaMemcpyDeviceToDevice);

        auto t2 = std::chrono::high_resolution_clock::now();

        cudaFree(tmp);

        auto t3 = std::chrono::high_resolution_clock::now();

        tMalloc += static_cast<double>((t1 - t0).count())/1000000.0;

        tCopy += static_cast<double>((t2 - t1).count())/1000000.0;
        tFree += static_cast<double>((t3 - t2).count())/1000000.0;

    }
    auto end = std::chrono::high_resolution_clock::now();
    std::chrono::duration<double> elapsed = end - start;

    std::cout << " cudaMalloc " << tMalloc / n << " ms, "
              << " cudaMemcpy " << tCopy / n << " ms, "
              << " cudaFree " << tFree / n << " ms"
              << std::endl;

    cudaFree(in);
}

When I run this on the Xavier A, I get the following output:

cudaMalloc 11.9218 ms,  cudaMemcpy 0.0491907 ms,  cudaFree 0.974387 ms

When running on the Xavier B, the output looks as follows:

cudaMalloc 6.02418 ms,  cudaMemcpy 0.0661738 ms,  cudaFree 0.953712 ms

So the “cudaMalloc” takes much longer than it should. It is also much slower on the Xavier A than on the Xavier B. Before running this test, I enabled the usage of all 6 CPU cores as described here and stopped all services I don’t need as described here

For comparison, I run my code also on a DrivePX2 with the following results:

On TegraA:

cudaMalloc 0.926063 ms,  cudaMemcpy 0.084942 ms,  cudaFree 1.32754 ms

On TegraB:

cudaMalloc 0.638675 ms,  cudaMemcpy 0.0383388 ms,  cudaFree 1.34566 ms

So I am wondering if there is something wrong with my setup or if others do see the same result.
Furthermore, does anybody have an idea how memory for the iGPU could be allocated faster on the DriveAGX?
Dear klaus.kofler,
In general memory allocation calls are not deterministic and expected to allocate at the beginning in your application to avoid glitches in your measurement.
I also notice few msec to for memory allocation calls on my machine too with DRIVE SW 10.0. Do you see any unexpected behaviour with other CUDA API calls.

Dear SivaRamaKrishnaNV,

I understand that memory allocation calls are not deterministic, but I have run a lot of experiments over the last days and the differences that I have seen between Xavier A and B as well as the differences between DriveAGX and DrivePX2 are definitively statistically relevant. Also, it is not a small difference, but an order of magnitude between DriveAGX and DrivePX2. If this overhead cannot be avoided, we will have to do substantial changes to our project to achieve DrivePX2 level performance on the DriveAGX.

Looking through the nvprof trace of our application, I did indeed see some other unexpected (slow) behaviours. Among them are:

  • cudaStreamSynchronize blocking the CPU thread after the kernel execution on the GPU terminated
  • dwSensorCamera_getImage with the flag DW_CAMERA_OUTPUT_CUDA_RGBA_UINT8 taking longer than expected
  • cudaCreateTextureObject being slow
  • cudaFree being slow

I assume that those issues are related to the slow memory allocation, as they only occur in programs when multiple CPU threads are accessing the iGPU and one thread calls cudaMalloc while the other thread executes one of the instructions mentioned above. When running either on the DrivePX2 or using the dGPU on the DriveAGX, none of these issues persist.

Dear klaus.kofler,
This is surprising. Is it possible to recheck flashing once for confirmation. Also, did you see similar issues on DRIVE SW 9.0/8.0?
dwSensorCamera_getImage() API does not has any memory creation.
cudaStreamSynchronize() blocks the CPU thread until all operations are completed on the stream.

Dear SivaRamaKrishnaNV,

I already tried re-flashing the DriveAGX from a fresh sdk-manager installation, that did not solve the issue. Furthermore, if I understood your earlier post correctly, the memory allocation is just as slow on your side too, right?

We never did an in depth analysis on DRIVE SW 9.0, but we did run our application and did not notice any issues, so I would assume it behaved differently. However, I cannot verify this any more. Would be great if someone could run the test program posted above on an older DRIVE SW installation.

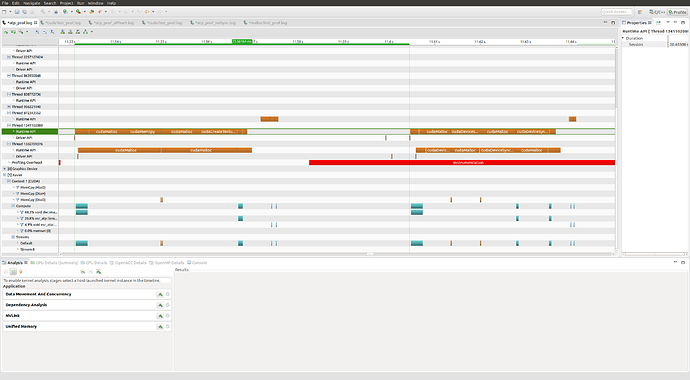
I attached a screenshot of the nvprof’s trace. One can clearly see that cudaMallocs take to long and block also things like cudaStreamSynchronize() (obviously as we only use one stream) and cudaCreateTextureObject. This results in a quite low usage of the iGPU.

So the question is, is this the expected behavior of the DriveAGX? Is there a faster way to allocate memory for the iGPU?

Dear klaus.kofler,
We can allocate memory on GPU only using cudaMalloc(). There is no faster way as such. We recommend creation of memory buffers once in the begining and re-use them in the application as creating them in the middle of application introduce undeterministic latency. CUDA malloc is a blocking call. Also, we do not focus on memory allocation API KPI as it is just one time allocation in an application typically. I do notice more allocation time using DRIVE SW 10.0.

Could you share you nvprof file to get more insights into the issue.

Dear SivaRamaKrishnaNV,

I created another minimal program to illustrate the issue when running in multiple threads.

#include <thread>
#include <functional>
#include <cuda.h>

cudaTextureObject_t createTexture(float* buffer, int width, int height) {
    // create resource description object
    cudaResourceDesc resDesc;
    memset(&resDesc, 0, sizeof(resDesc));
    resDesc.resType = cudaResourceTypePitch2D;
    resDesc.res.pitch2D.devPtr = (void*)buffer;
    resDesc.res.pitch2D.desc.f = cudaChannelFormatKindFloat;
    resDesc.res.pitch2D.desc.x = sizeof(float) * 8;
    resDesc.res.pitch2D.desc.y = 0;
    resDesc.res.pitch2D.desc.z = 0;
    resDesc.res.pitch2D.desc.w = 0;
    resDesc.res.pitch2D.width = width;
    resDesc.res.pitch2D.height = height;
    resDesc.res.pitch2D.pitchInBytes = width*sizeof(float);

    // create texture descriptor
    cudaTextureDesc texDesc;
    memset(&texDesc, 0, sizeof(texDesc));
    texDesc.readMode = cudaReadModeElementType;
    texDesc.addressMode[0] = cudaAddressModeBorder;
    texDesc.addressMode[1] = cudaAddressModeBorder;
    texDesc.addressMode[2] = cudaAddressModeBorder;
    texDesc.filterMode = cudaFilterModeLinear;
    texDesc.normalizedCoords = false;

    // create texture
    cudaTextureObject_t tex = 0;
    cudaCreateTextureObject(&tex, &resDesc, &texDesc, NULL);
    return tex;
}

void threadWorker(int n, int device, unsigned sizeX, unsigned sizeY) {
    cudaSetDevice(device);

    auto start = std::chrono::high_resolution_clock::now();
    for(int i = 0; i < n; ++i) {
        float* tmp;
        cudaMalloc(&tmp, sizeX*sizeY*sizeof(float));
        cudaTextureObject_t tex = createTexture(tmp, sizeX, sizeY);
        cudaFree(tmp);
    }
}

int main (int argc, char** argv){
    int n = 100;
    int device = 1;
    unsigned sizeX = 1920u;
    unsigned sizeY = 1208u;

    std::thread thread0 = std::thread(std::bind(threadWorker, n, device, sizeX, sizeY));
    std::thread thread1 = std::thread(std::bind(threadWorker, n, device, sizeX, sizeY));

    thread0.join();
    thread1.join();
}

The call to “cudaCreateTextureObject” is just an example as all calls to the device 1 will be blocked during the time the “cudaMalloc” is allocated on the other thread.

I attached the nvprof output for this code for both, the DriveAGX and the DrivePX2 (which runs this example roughly 4 times faster).

I understand that allocating memory buffers only once and reusing them is faster, but it is also a bit inconvenient at times. And it is quite surprising to see, that the allocation did get so much slower when moving from the DrivePX2 to the DriveAGX.
nvprofDrivePX2.log (155 KB)
nvprofDriveAGX.log (420 KB)

I switched from using “cudaMalloc” to the CachingDeviceAllocator to re-use previously allocated memory if it is not needed any more. That solved my performance issues.