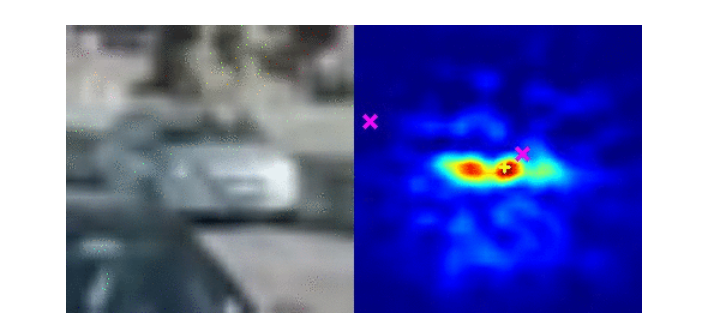
I am referring Gst-nvtracker plugin guide page and in the Data association topic i found below image for understanding but I also want to get the similar kind of output for my video with this gradcam representation as shown below :-
So, As a output of my input video I want similar kind of output. So how i can get this ? Is there any way in deepstream through which i can generate the same kind of output as shown in the image or any other parameter in the config file which basically generate this kind of output?.
yeah opencv provide functionality of heatmap. So, i will refer that but i want to ask like that image i have uploaded above that result functionality have in deepstream or this is implemented externally using opencv and then uploaded here in the tracker documentation?
Unfortunately, the correlation response map is currently kept as an internal data inside the tracker library, and not exposed to the users yet. What’s the usecase of such visualization from your side?
There is no update from you for a period, assuming this is not an issue anymore.
Hence we are closing this topic. If need further support, please open a new one.
Thanks