Hi, I am profiling a read-only kernel in Nsight Compute on A100. The kernel is very simple and the complete code is as below.
#include <cstdint>
#include <cuda.h>
#include <cuda_runtime.h>
#include <iostream>
const int BLOCK = 1024;
const int BENCH_SIZE = (1lu << 26); //
const int THREAD_STRIDE = (1lu << 16); //
const int BLOCK_STRIDE = (1lu << 8);
const int BENCH_ITER = 16;
#define checkCudaErrors(err) __checkCudaErrors (err, __FILE__, __LINE__)
inline void __checkCudaErrors( CUresult err, const char *file, const int line )
{
if( CUDA_SUCCESS != err) {
fprintf(stderr,
"CUDA Driver API error = %04d from file <%s>, line %i.\n",
err, file, line );
exit(-1);
}
}
__device__ __forceinline__
int ldg_cs_v1(const void *ptr) {
int ret;
asm volatile (
"ld.global.cs.b32 %0, [%1];"
: "=r"(ret)
: "l"(ptr)
);
return ret;
}
__device__ __forceinline__
void stg_cs_v1(const int ®, void *ptr) {
asm volatile (
"st.global.cs.b32 [%1], %0;"
: : "r"(reg), "l"(ptr)
);
}
__global__ void read_kernel(const void *x, void *y) {
for (int i = 0; i < BENCH_ITER; i++)
{
uint32_t idx = BENCH_SIZE * i + blockIdx.x * BLOCK_STRIDE + threadIdx.x * THREAD_STRIDE;
const int *ldg_ptr = (const int *)x + idx;
int reg;
reg = ldg_cs_v1(ldg_ptr);
// LDG can be optimized away by the compiler, below to prevent
if (reg != 0) {
stg_cs_v1(reg, (int*)y);
}
}
}
int main() {
size_t size_in_byte = (1lu << 30) * 16; //(8GB)
int numBlocks;
cudaOccupancyMaxActiveBlocksPerMultiprocessor(&numBlocks, read_kernel, BLOCK, 0);
printf("Blocknum per SM: %d\n", numBlocks);
char *ws;
cudaMalloc(&ws, size_in_byte);
// set all zero for read-only kernel
cudaMemset(ws, 0, size_in_byte);
cudaEvent_t start, stop;
cudaEventCreate(&start);
cudaEventCreate(&stop);
float time_ms = 0.f;
cudaEventRecord(start);
read_kernel<<<numBlocks * 108, BLOCK>>>(ws, nullptr);
cudaEventRecord(stop);
cudaEventSynchronize(stop);
cudaEventElapsedTime(&time_ms, start, stop);
printf("time_ms: %f\n", time_ms);
cudaFree(ws);
return 0;
}
The read_kernel use ld.global.cs to load from global memory. I use ‘.cs’ because this kernel handles streaming data and does not need data reuse. The memory access pattern is as the figure below.
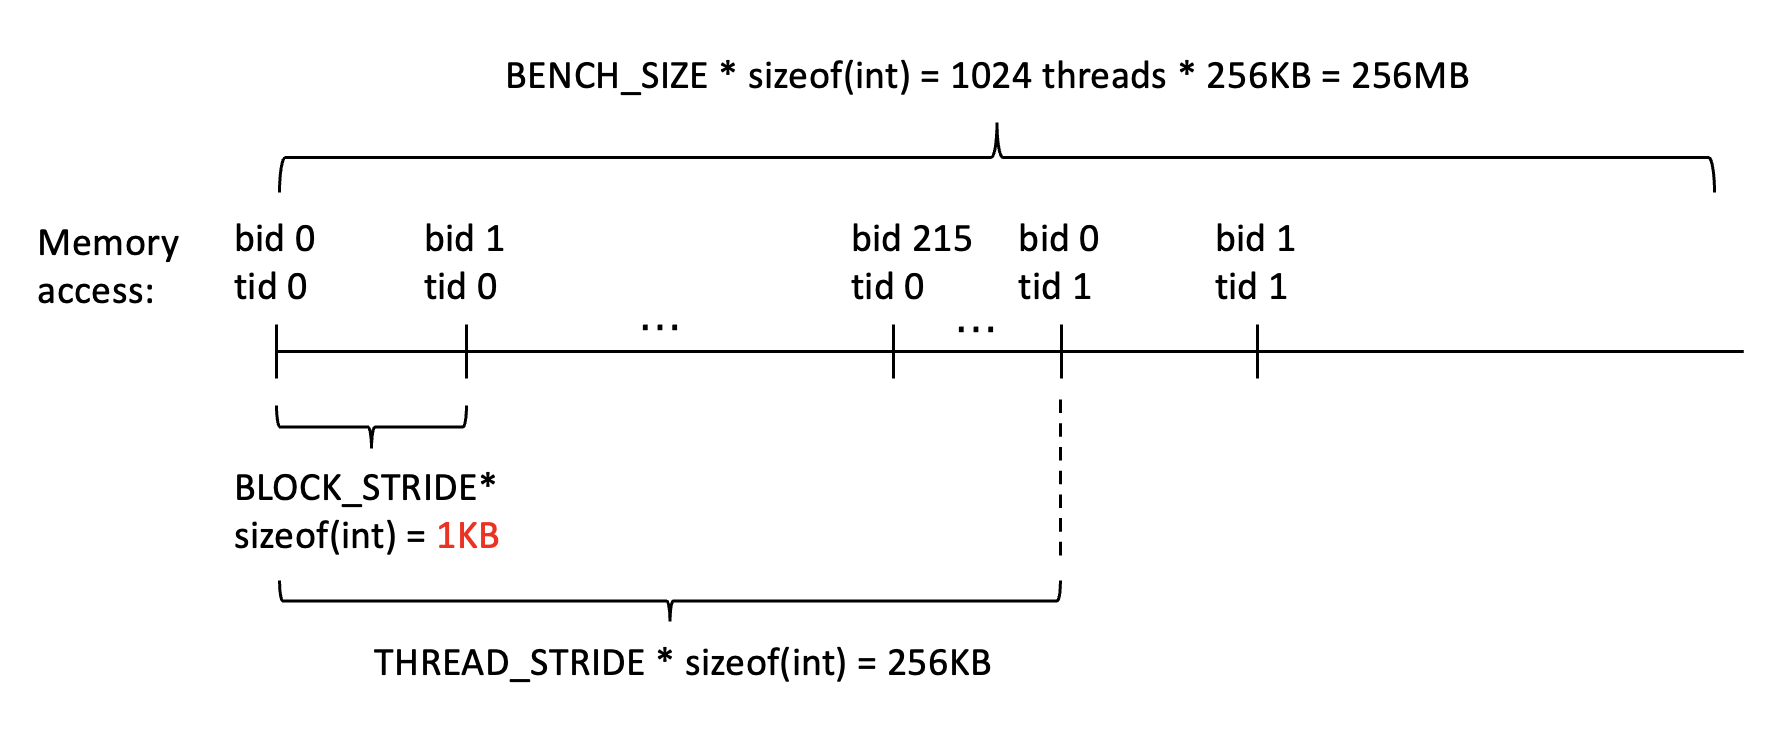
As you can see, there is a large stride between memory access of adjacent threads (1KB) and this gap is larger than the L2 cache line size. I did this intentionally because I did not want this kernel to hit L2 cache. Thus, each memory address is used only once when loading the data. Then I expect the L2 cache hit rate of this kernel to be zero.
However, the profiling result does not support my guess.

read_write_kernel.ncu-rep (1.7 MB)
The L2 cache hit rate is 50% and the troublemaker seems to be the L2 Fabric. As shown below, the request count of L1/TEX load is correct (3538944=216blocks * 1024threads * 16 memory access). Then, what are the requests from L2 Fabric? I know that there may be two partitions of L2 cache and they have to transfer data to each other. But what is the hit rate under this scenario? From my understanding, the requests of GPU total should be 3538944 and the hit rate should be 0.

The commands to reproduce the results are as below:
nvcc test.cu -arch sm_80 -lcuda -o test
./test
ncu -f -o read_write_kernel --set full --section MemoryWorkloadAnalysis_Chart --replay-mode application ./test
I am not pursuing a high-performance kernel but just want to know why the result is not as expected. So I may not need any advice to optimize this kernel.
PS, I also find that using different cache eviction policies will also cause the L2 Fabric hit rate to vary. If I change the ‘.cs’ to ‘.cg’ in my ptx code (Reference), the L2 cache hit rate is then 20% and the ncu report is as below. Can anybody give me some explanations? Thanks a lot!
read_write_kernel.ncu-rep (1.7 MB)