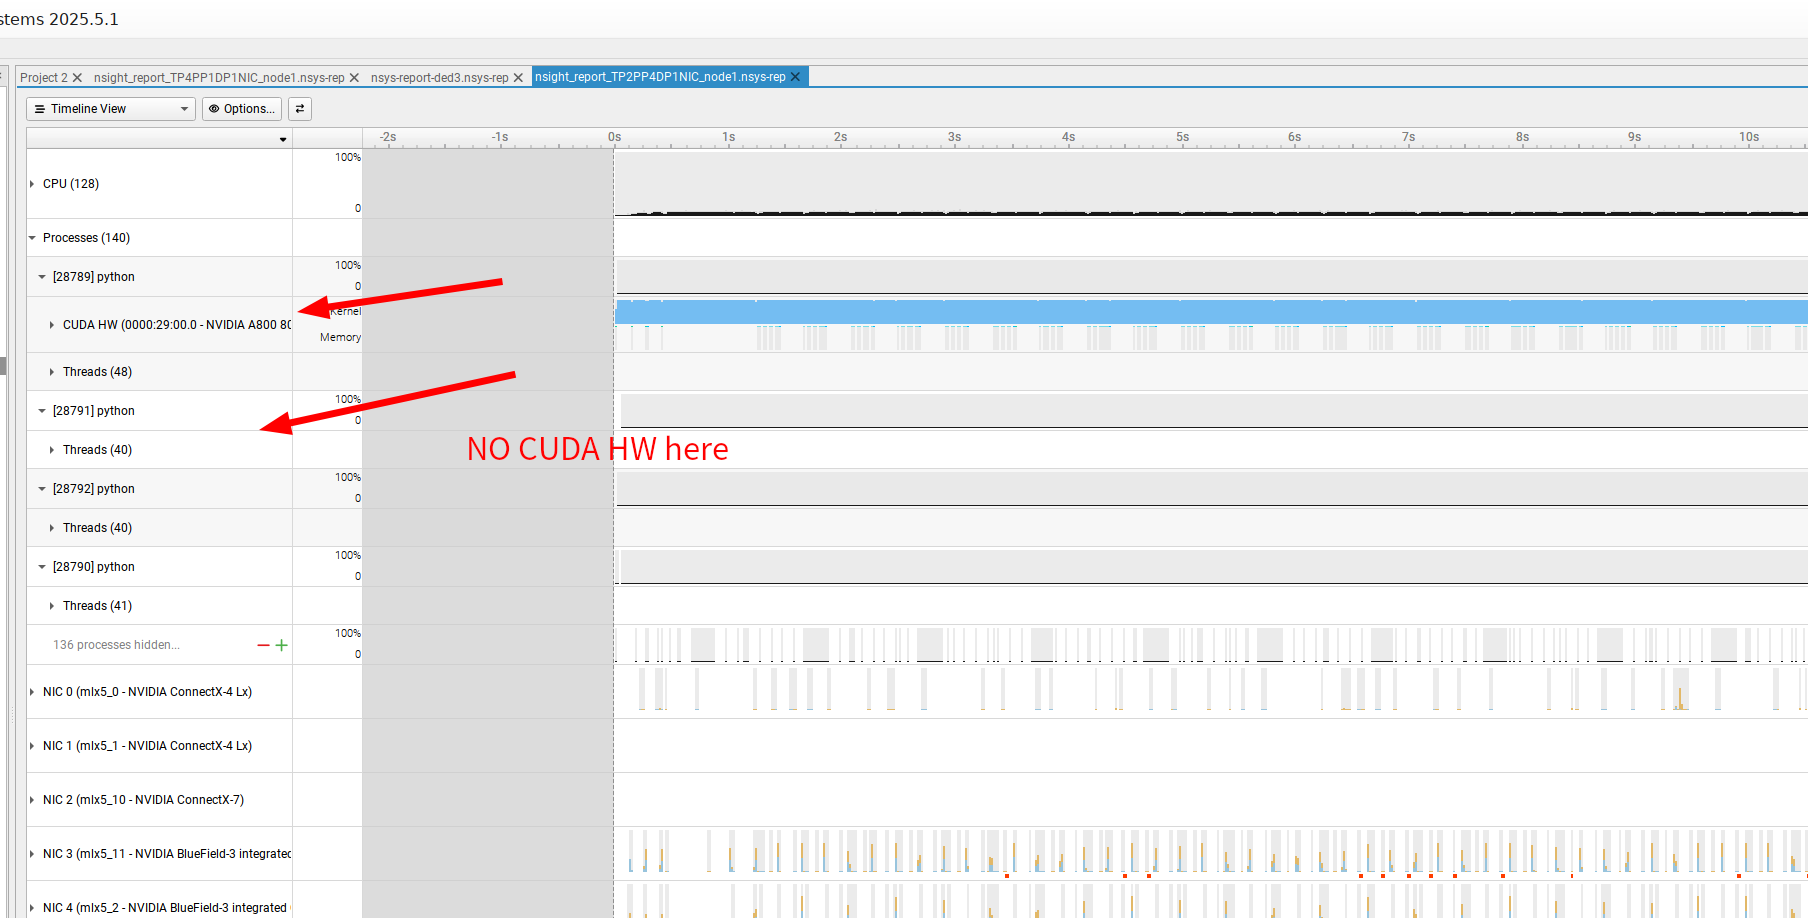
I am profiling a multi-node Megatron-LM training run, but my nsys report is only showing the CUDA HW Timeline for one single GPU (or one rank), despite running the job across 2 servers with a total of 8 GPUs (4 GPUs per node). The hardware metrics for the remaining 3 GPUs are missing.
Environment and Parallelism
Framework: Megatron-LM (using pretrain_gpt.py script via torchrun).
How should I modify the nsys profiling strategy to reliably capture CUDA HW metrics for all 4 GPUs on the local node (Node 1), or ideally, for all 8 GPUs across both nodes?
Hi @lunsheng231 , if you expand the threads row for process 28791, are there any “CUDA API” rows under any of the threads? And if so, are there any “cu(da)LaunchKernel()” API calls on the row?
Is there any warning/error in the diagnoistic messages (upper right corner of the report window)?
Is it possible to share the report for us to take a look?
Is it possible to try the following and see if there’s any difference?
Change --capture-range-end=stop to --capture-range-end=none in your command
Add –-session-new=my_profile_session in your command
After the collection is started, wait for about 15 seconds (i.e. the duration of the report you shared), and run nsys stop --session=my_profile_session to manually stop the collection.
Check the generated report
The reason is that I’m suspecting currently only the process 28789 that called cudaProfilerStop() API had a chance to properly flushed the buffers holding CUDA events. Other processes might not have a chance to flush it and caused events to be lost (if that’s the case, it’s an issue in Nsys we need to look into). By setting --capture-range-end=none and manually calling nsys stop, we can force the buffers in all processes to be flushed so we can confirm/rule out this theory (and you can use it as an WAR if it works).
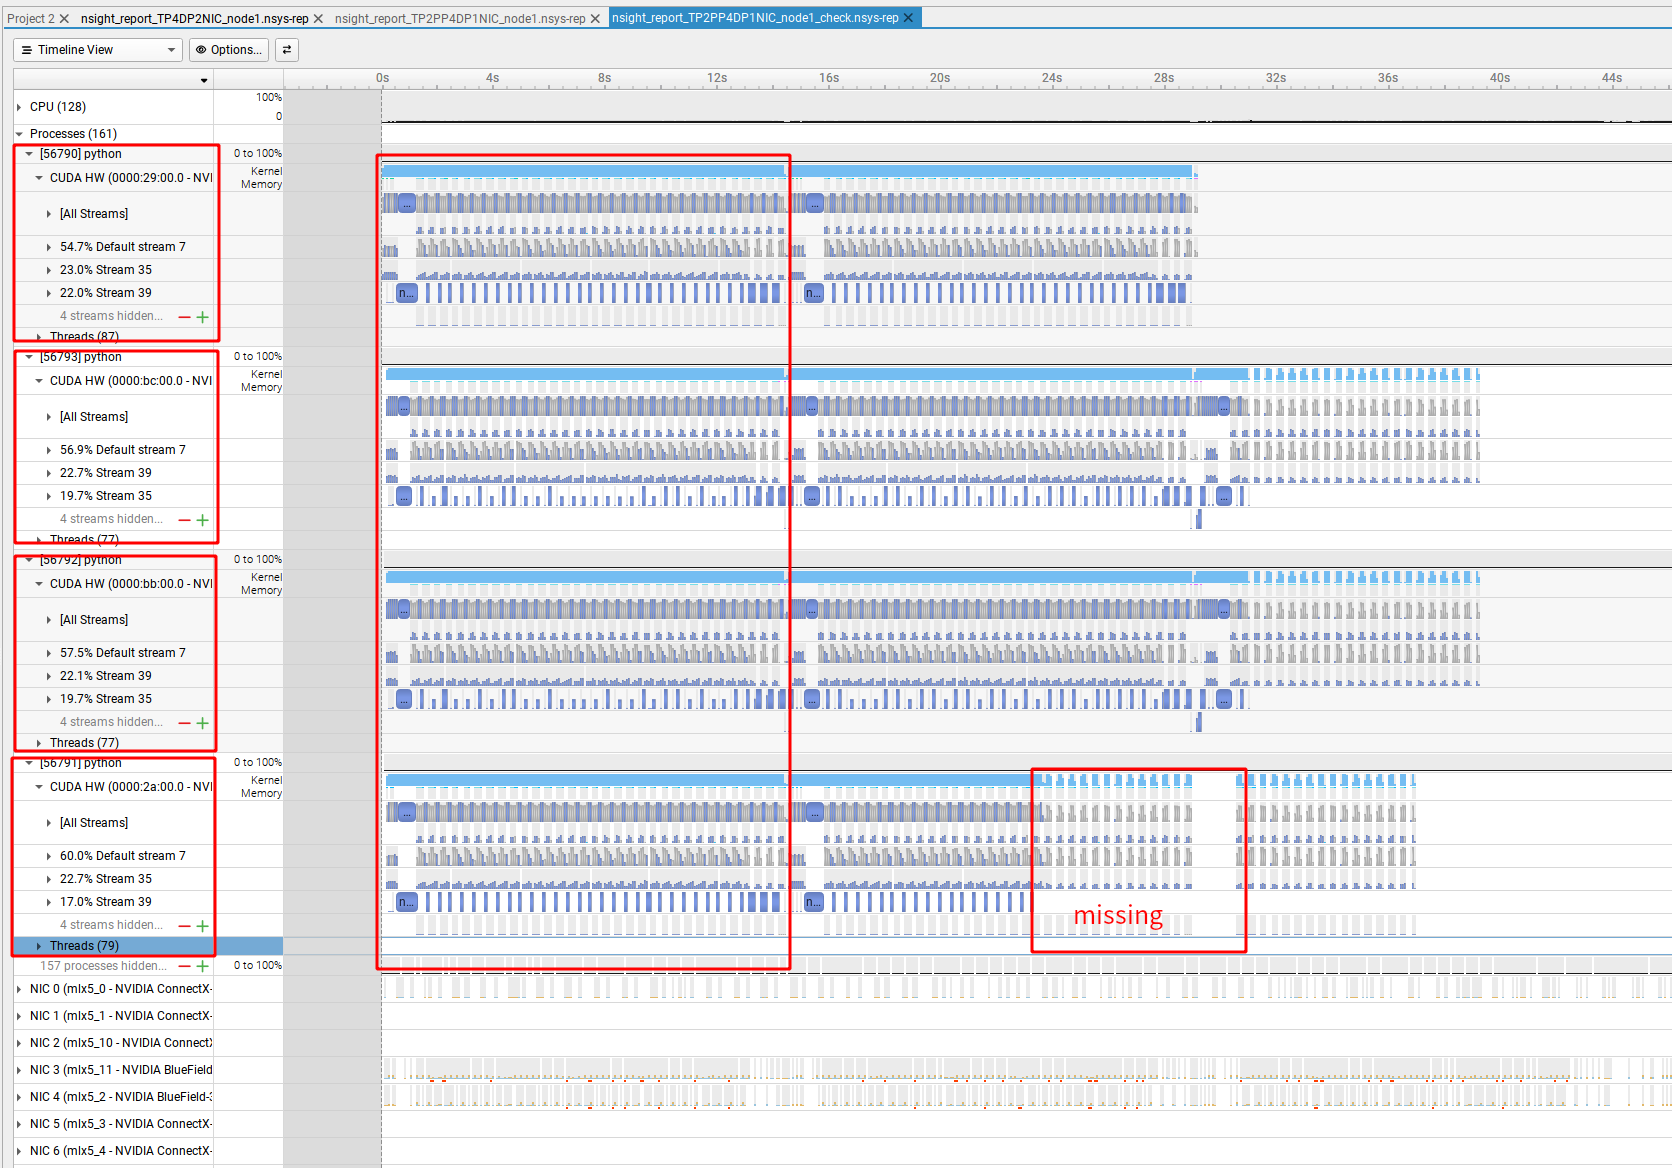
Under the same configuration for my Megatron-LM Llama3 pre-trainging, I can observe that one entire training GlobalStep within the first 15 seconds. I stop the command later, and the resulting profile is missing some events, given that these two Global Steps should ideally be identical.
But this seem not work, so I just stopped my training command.
The nsys stop --session=my_profile_session should stop the collection and generate a report, but the target app will keep running and needs to be manually terminated.
Under the same configuration for my Megatron-LM Llama3 pre-trainging, I can observe that one entire training GlobalStep within the first 15 seconds.
The report confirms the theory - in capture range mode, only the process invoking cudaProfilerStop() has a chance to flush buffers, other processes are more like being terminated forcibly and will lose some events. We will need to look into it internally (I have opened a ticket DTSP-21073 in our internal tracking system). Please manually call nsys stop as an WAR for now.
I stop the command later, and the resulting profile is missing some events, given that these two Global Steps should ideally be identical.
Is it possible that process 56791 hasn’t really executed those kernels by the time you stopped?
Sorry for the late reply. Thanks for your help.
By manually stopping the profile session, I am able to successfully capture all 4 GPUs within my server.