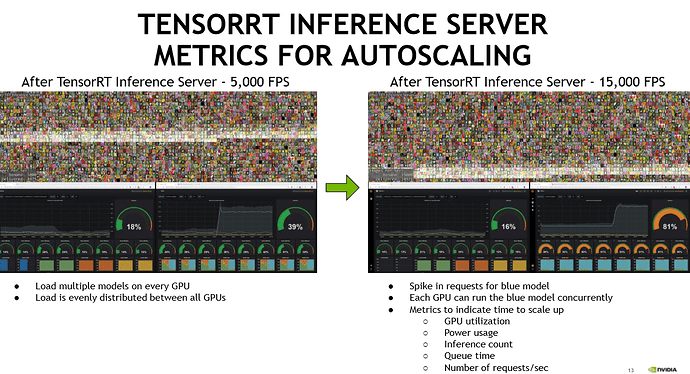
Hi all, is there some kind of visualization tool to visualize the TensorRT Inference Server performance metrics as shown in the webinar Maximizing GPU Utilization for Data Center Inference with NVIDIA TensorRT Inference Server on GKE with Kubeflow
Hello,
prometheus and grafana were used to visualize the demo.
thanks @NVES, is there some example that shows how to extract the metrics performance from TRTIS and visualize these with prometheus and grafana?

