I’m profiling a multi-process workload running under CUDA MPS and observed something odd in Nsight Systems.
In the timeline view, the CUDA HW trace suddenly ends (no more kernel launches are shown), but the SM Active / Warp Occupancy / DRAM Bandwidth metrics stay high for quite a while afterward as if the GPU is still running kernels.
Here’s the situation:
-
One process (client 1) runs a LLM workload.
-
Another process (client 2) runs a simple dummy kernel to generate DRAM traffic (dummy_dram_unit_stride)
-
Both processes are launched under MPS, and Nsight Systems is attached to the dummy kernel process.
-
As shown in the attached screenshot, the CUDA HW activity “cuts out” for the LLM process, but the SM and memory metrics follows the LLM activity until the end.
Nsight seems to stop capturing CUDA HW activity for the profiled process even while it’s still executing GPU kernels, though the GPU metrics remain active. Why is this happening? Does Nsight lose visibility under MPS, or does it end the trace too early for some unexpected reason?
Hi, thanks for the reply.
There is a warning indicating that CUDA event collection might have failed.
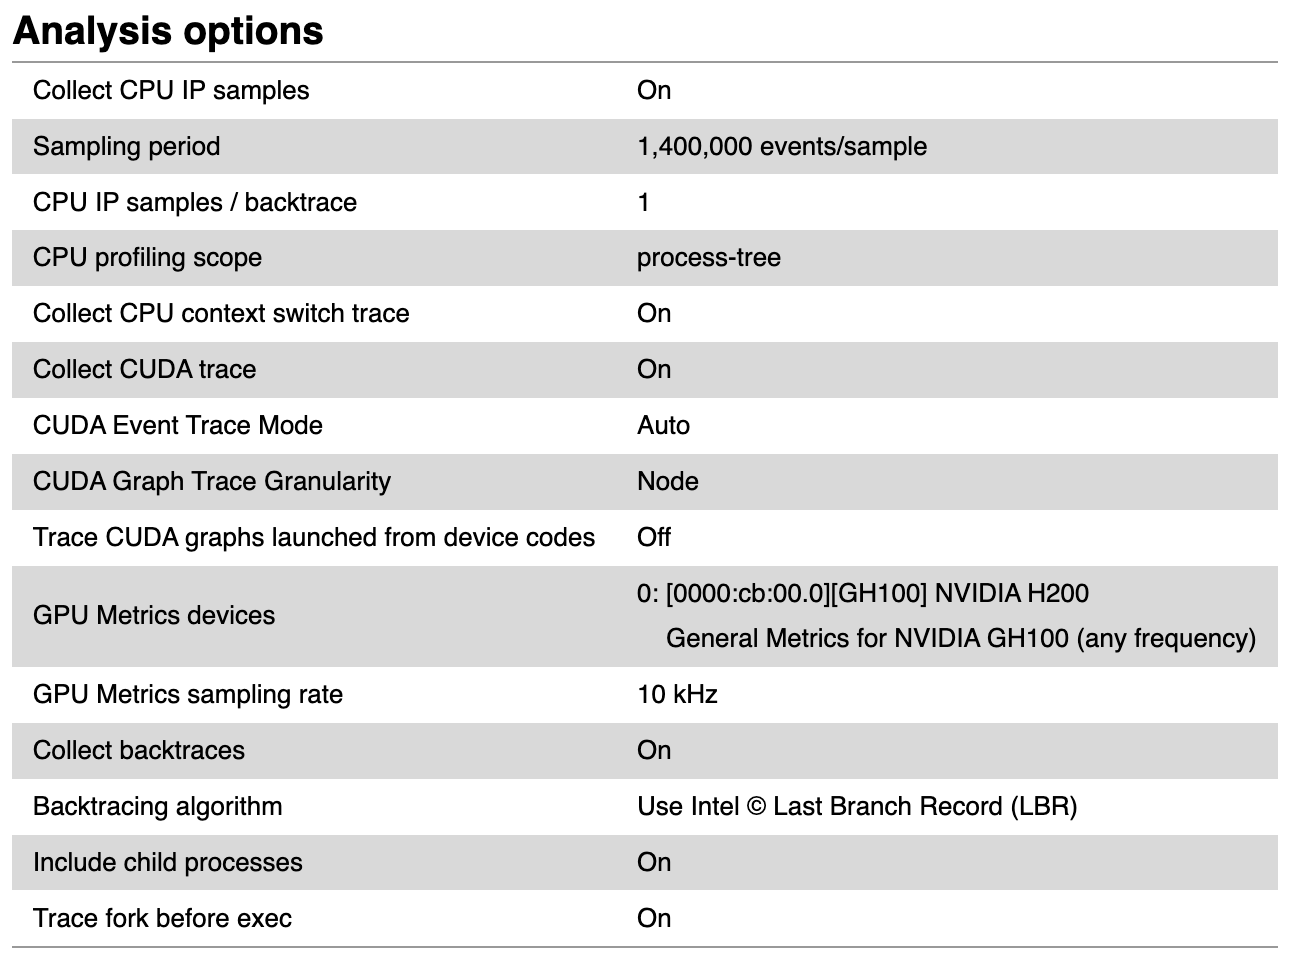
I have attached the diagnostic messages and configurations.
(attachments)
Could you try checking which processes were traced, and if you see the MPS server PID present there or not, in addition to the 2 you mentioned?
The MPS server PID is missing from the summary page, although other processes that run kernels appear in the list.
Ok, that checks out. Under CUDA MPS, Nsight Systems traces only the processes it directly injects into, and MPS clients don’t actually own GPU contexts, the MPS server does. Each client merely enqueues work that the server submits to the GPU. Because Nsight was attached only to the dummy kernel client, it recorded that client’s CUDA HW activity until it stopped launching kernels. The LLM client’s kernels, however, were executed by the MPS server under a different PID, which Nsight didn’t trace. Meanwhile, the GPU Metrics section reports device-wide counters that include all GPU activity, so utilization stayed high even after the traced client’s CUDA HW rows ended. In short, Nsight saw the clients enqueue work but not the server actually executing it; you could try attaching to or profiling the MPS server to see different results.