Hi,
I’ve been benchmarking the cudss_mgmn_distributed_matrix example from cuDSS on several GPUs — RTX 4060, RTX 4090, and NVIDIA A100 — using OpenMPI with mpirun -np 1 to run a single process on each GPU.
Setup:
- Modified the example to load double-precision matrices from
.mtx files.
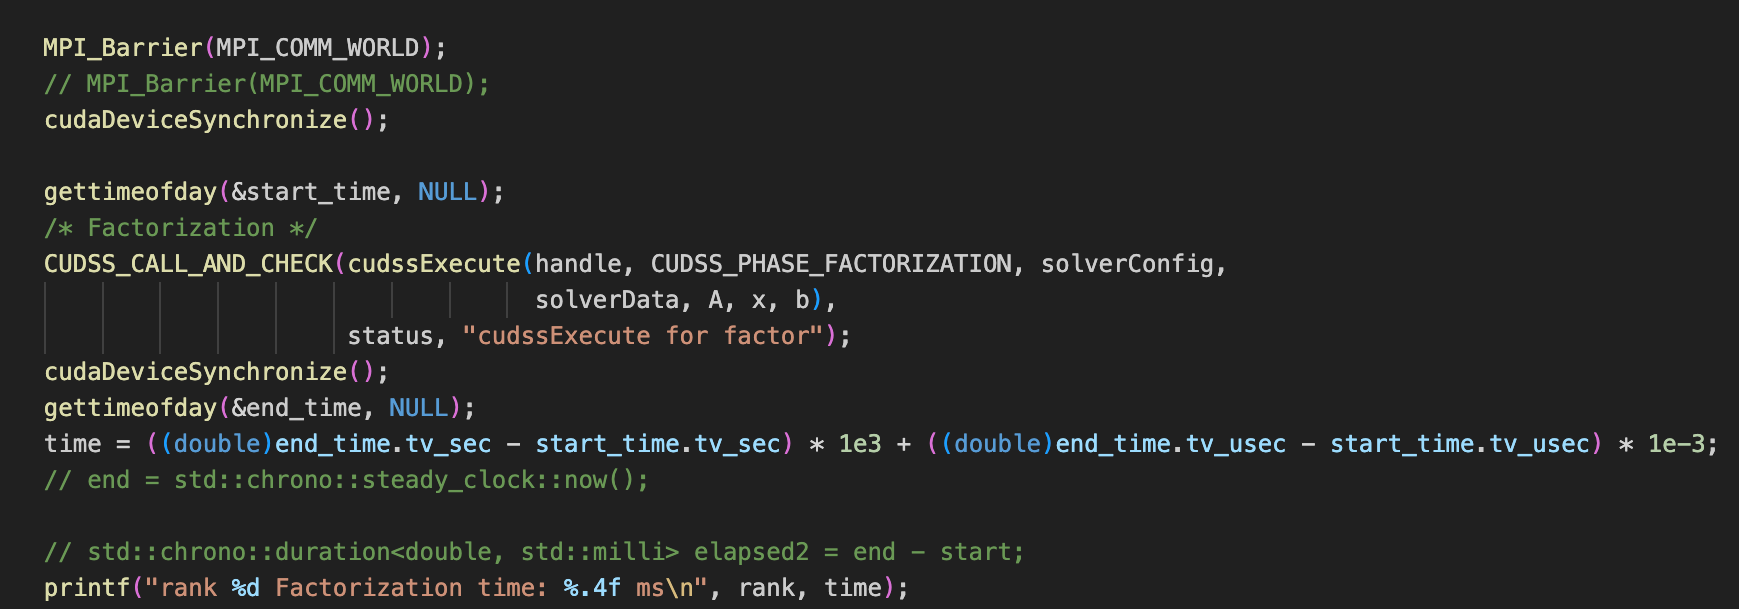
- Added timing code using both
gettimeofday() and std::chrono::steady_clock::now() to get reliable execution times before and after cudssExecute.
- Since cuDSS does not expose internal FLOP counters or nonzero statistics, I used SuperLU_DIST’s flop count to estimate GFLOPs for comparison.
Observation:
- On RTX 4060 and 4090, several test matrices report GFLOPs that are more than 2× higher than the theoretical peak FP64 performance of the GPU.
- On A100, the performance is roughly 10% of the peak, which seems more reasonable.
- All results have relative numerical error < 1e-10.
- The timing code used for measurement is shown below:
Questions:
- Could this be due to a misestimation of FLOP count (from SuperLU_DIST) not matching cuDSS’s actual workload?
- Is cuDSS performing some optimized computation (e.g., reduced flops, mixed precision) that causes the GFLOPs calculation to be misleading?
- Has anyone observed inflated performance metrics like this when using cuDSS or similar sparse solvers on consumer GPUs (Lovelace, Ada)?
- Is there a better way to estimate actual FLOPs or execution efficiency for cuDSS?
Any insights would be appreciated!
Hi @duyang112023!
Thanks for sharing your findings!
Short reaction: I’d guess that most likely the FLOPS estimate is off. You can probably check with a performance profile from Nsight Compute that cuDSS doesn’t exhibit performance higher than theoretical FLOPs at any moment of the execution.
Comments:
I’ve been benchmarking the cudss_mgmn_distributed_matrix example from cuDSS on several GPUs — RTX 4060 , RTX 4090 , and NVIDIA A100 — using OpenMPI with mpirun -np 1 to run a single process on each GPU
From your description, it looks like the results would be exactly the same if you benchmark non-MGMN mode of cuDSS.
- Could this be due to a misestimation of FLOP count (from SuperLU_DIST) not matching cuDSS’s actual workload?
Yes. We can’t say right now how different FLOP counts from SuperLU_DIST would be compared to cuDSS. One thing which makes sense to check is the number of nonzeros in the factors. If those counts are different, it would definitely hint at the flops estimate mismatch.
- Is cuDSS performing some optimized computation (e.g., reduced flops, mixed precision) that causes the GFLOPs calculation to be misleading?
In general, sparse direct solvers as a domain don’t have restrictions about using or not using such tricks (and different solvers have different features for improving performance or accuracy and some workloads benefit from them and some don’t). However, as of right now (up to cudss 0.6.0), we don’t do anything like that in cudss. On the other hand, cudss depends on cublas (in addition to our custom kernels) and if cublas kernels do any tricks, cudss has no control over it.
- Has anyone observed inflated performance metrics like this when using cuDSS or similar sparse solvers on consumer GPUs (Lovelace, Ada)?
- Is there a better way to estimate actual FLOPs or execution efficiency for cuDSS?
For sparse direct solvers, people often find that having a proper performance model with a predictive power is notoriously hard. So I suggest to think about what you want to achieve.
If you want to compare cuDSS with other solvers, then you can just take representative matrices from your application (assuming you have one) and compare runtimes.
If you want to study GPU utilization and estimate efficiency, one of the better ways might be to look at performance profiles, e.g., from Nsight Compute. The tricky thing is that direct sparse solver performance (even if you limit your attention to factorization and/or solve phases) does not have a monolithic behavior: there are otten parts which are more memory bandwidth bound, or compute bound.
if you want to have a FLOPS estimate to do a dispatch and thus currently are missing FLOPS esimtate from cuDSS, it can be a feature request [it’s a question of when we will have resources to implement it, where telling us about your application would helps us to prioritize the request]
Thanks,
Kirill
I’m currently using cuDSS with the timing methods described above. I’ve noticed that, compared to other sparse direct solvers like MUMPS and SuperLU_DIST, cuDSS shows significantly better performance in the numerical factorization phase.
However, I’m not entirely confident whether my timing or usage of cuDSS is entirely correct, so I tried to evaluate performance from another perspective — by estimating GFLOPs.
Since cuDSS does not expose the number of nonzeros after symbolic factorization or internal matrix structures, I couldn’t calculate the actual number of FLOPs performed by cuDSS. Instead, I used SuperLU_DIST’s FLOP count as a rough approximation.
The resulting GFLOPs, however, exceeded the theoretical peak performance of the GPU, which made me question whether I was measuring time incorrectly. But given how simple the timing code is, there doesn’t seem to be much room for a mistake there.
So now I’m wondering:
- Could cuDSS be using some advanced reordering techniques that significantly reduce the number of nonzeros after symbolic factorization, resulting in much lower actual FLOPs?
- Or is there some other reason for this unexpected performance?
Any insights would be appreciated!
I’m currently using cuDSS with the timing methods described above. I’ve noticed that, compared to other sparse direct solvers like MUMPS and SuperLU_DIST , cuDSS shows significantly better performance in the numerical factorization phase.
I am not sure about SuperLU_DIST, but MUMPS is not a GPU native solver, it only (at best) offloads some parts of the computations to the GPU. So it is by no means a surprise that a GPU-native solver like cuDSS is much faster.
Since cuDSS does not expose the number of nonzeros after symbolic factorization
You can check the number of nonzeros by calling cudssDataGet() with CUDSS_DATA_LU_NNZ, see e.g. CUDALibrarySamples/cuDSS/simple_get_set/simple_get_set.cpp at master · NVIDIA/CUDALibrarySamples · GitHub (it is called there after the factorization but it should work already after the analysis).
But given how simple the timing code is
Right. The often repeated mistake is missing synchronization (because by default, cuDSS factorization and solve are asynchronous, which also would be true for MGMN with a single process) but your code snippet has it.
- Could cuDSS be using some advanced reordering techniques that significantly reduce the number of nonzeros after symbolic factorization, resulting in much lower actual FLOPs?
No. The number of nnz is determined during the ANALYSIS phase. And cuDSS will have that number of values in the factors.
- Or is there some other reason for this unexpected performance?
How large is your matrix? Do you use any non-default features of cuDSS like hybrid execution? Did you check for errors/ validate the result (one simple reason for ultrafast execution can be errors during kernel execution)
Thank you for the suggestions!
I used the matrix from Oberwolfach/gas_sensor. I called cudssDataGet() with CUDSS_DATA_LU_NNZ after CUDSS_PHASE_ANALYSIS as you suggested, and compared it with SuperLU_DIST’s reported nonzero count after symbolic factorization — the difference is less than 1%, so the structure seems consistent.
However, on RTX 4060, the numerical factorization phase finishes in about 300 ms, and based on the FLOP estimate from SuperLU_DIST, the resulting GFLOPs is more than 2× the theoretical FP64 peak of the GPU, which seems suspicious.
Here is my build and run setup:
Compile command:
nvcc cudss_mgmn_distributed_matrix_readfile.cpp -DUSE_MPI -DUSE_OPENMPI \
  -I$CUDSS_DIR/include -L$CUDSS_DIR/lib -L$CUDA_HOME/lib64 \
  -lcudss -lcudart -lmpi -ccbin mpicxx \
  -o cudss_mgmn_distributed_matrix_readfile
Run command:
mpirun -np 1 ./cudss_mgmn_distributed_matrix_readfile openmpi \
  /home/dy/libcudss-linux-x86_64-0.6.0.5_cuda12-archive/lib/libcudss_commlayer_openmpi.so \
  /home/dy/mtx-trojan-horse/gas_sensor/gas_sensor.mtx
Environment:
- CUDA 12.8
- OpenMPI 5.0.7
- cuDSS version 0.6.0.5
- RTX 4060, single-process run (
-np 1), no hybrid execution used.
The solution was validated and has a relative error below 1e-10, so I don’t think there were kernel failures or silent errors. That’s why I’m wondering if maybe the FLOP count is not representative of cuDSS’s actual workload, or if some internal optimization (e.g. reduced FLOPs due to reordering or reuse) might be leading to such a high performance value.
And I noticed that cuDSS supports computations in int, float, and double precision. Is the precision selected manually by the user, or is it automatically determined by the library? Is it possible that a double-precision matrix is being computed in float precision internally?
Would appreciate any thoughts on this!
Thanks for the details!
Unfortunately, I can’t say much more without investigating performance for the matrix.
Since, as you said, the solution is correctly computed, and as the cuDSS team knows that we don’t do any tricks with precision right now, I have to suspect that the FLOPS estimate doesn’t fit cuDSS (even though nnz in the factors are similar).
Do you have any information about how SuperLU_DIST computes the flop estimate? Maybe, e.g. somehow this estimate assumes that some sub-matrices are dense, while in fact they are sparse. Or it can easily be that updates during the factorization are done in a different way than in cuDSS and in cuDSS we do them more efficiently?
And I noticed that cuDSS supports computations in int , float , and double precision. Is the precision selected manually by the user , or is it automatically determined by the library? Is it possible that a double-precision matrix is being computed in float precision internally?
The precision is determined by the user and cudss doesn’t change it internally (if we start doing it, it would likely be exposed with a knob).
Thanks,
Kirill