I have been running the DGX Spark platform for a little over a month, primarily using Open‑WebUI. While the GPU performance is excellent initially, I’ve noticed that after running for more than 24 hours the GPU is no longer utilized and the workload reverts to the CPU. A simple Docker restart or full system reboot—temporarily restores GPU usage. Unfortunately, I have not been able to pinpoint the root cause or a permanent fix.
Has anyone else observed a similar pattern, and is there a known resolution? I would appreciate any guidance.
CONTAINER ID IMAGE COMMAND CREATED STATUS PORTS NAMES
3773c077b435 ghcr.io/open-webui/open-webui:ollama “bash start.sh” 7 days ago Up 2 hours (healthy) 0.0.0.0:12000->8080/tcp, [::]:12000->8080/tcp open-webui
I also have a virtual python environment for ComfyUI
My processes that are running look like:
±----------------------------------------------------------------------------------------+
| Processes: |
| GPU GI CI PID Type Process name GPU Memory |
| ID ID Usage |
|=========================================================================================|
| 0 N/A N/A 2829 G /usr/lib/xorg/Xorg 73MiB |
| 0 N/A N/A 2998 G /usr/bin/gnome-shell 18MiB |
| 0 N/A N/A 3522 C python 19841MiB |
±----------------------------------------------------------------------------------------+
can you share a sudo nvidia-bug-report.sh log when container is using GPU. and another sudo nvidia-bug-report.sh when the same container is no longer using GPU?
I may sound like a broken record, but I suggest dropping Ollama and switching to llama.cpp. You can use it with Open WebUI or it has it’s own web UI too.
I wouldn’t rely on NVIDIA-provided playbooks - as many of us encountered, they are often incomplete, under-performing or outright broken, with a few exceptions (like ComfyUI one).
My dashboard container after some period starts getting errors from nvidia-smi - I wonder if the GPU is being lost in the container in the same way for both of us.
(although FWIW, I haven’t seen it for several days.. possibly since a recent update, but could also just be fluke)
Interesting. I haven’t seen that with my cluster, but it wasn’t sitting idle for a long period of time. I’ll try to leave it running over a weekend and see what happens. I usually shut it down at night, because of the bug in Ray that keeps at least one core pegged at 100% in a busy loop, even when idle.
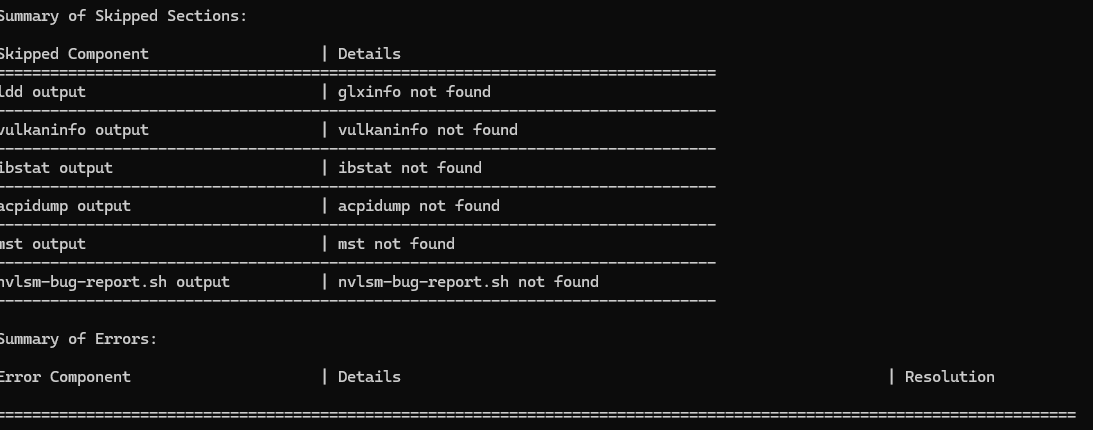
I hit mine again this morning. I posted some output from commands Gemini suggested might be helpful here:
Interestingly it also claimed this is a well known issue caused by using systemd instead of cgroupfs as the docker daemon cgroup driver. I posted details in the thread above, but I’d like a second opinion about that before I try it, because it didn’t give any sources 😄