The meaning of effective memory bandwidth in https://docs.nvidia.com/cuda/cuda-c-best-practices-guide/index.html#effective-bandwidth-calculation is effective ‘global’ memory bandwidth?
Also, the effective global memory bandwidth means memory throughput??
1 Like
the formula given as well as the description doesn’t have to apply to global memory. For example, with an appropriately designed test, and use of appropriate metrics (covered in the next section there) it could refer to shared memory bandwidth.
Nevertheless, global memory bandwidth is what is commonly being referred to.
memory throughput and memory bandwidth are often used interchangeably.
This could devolve into a semantics discussion, so I’ll leave it at that.
If so , I’m confused about something.
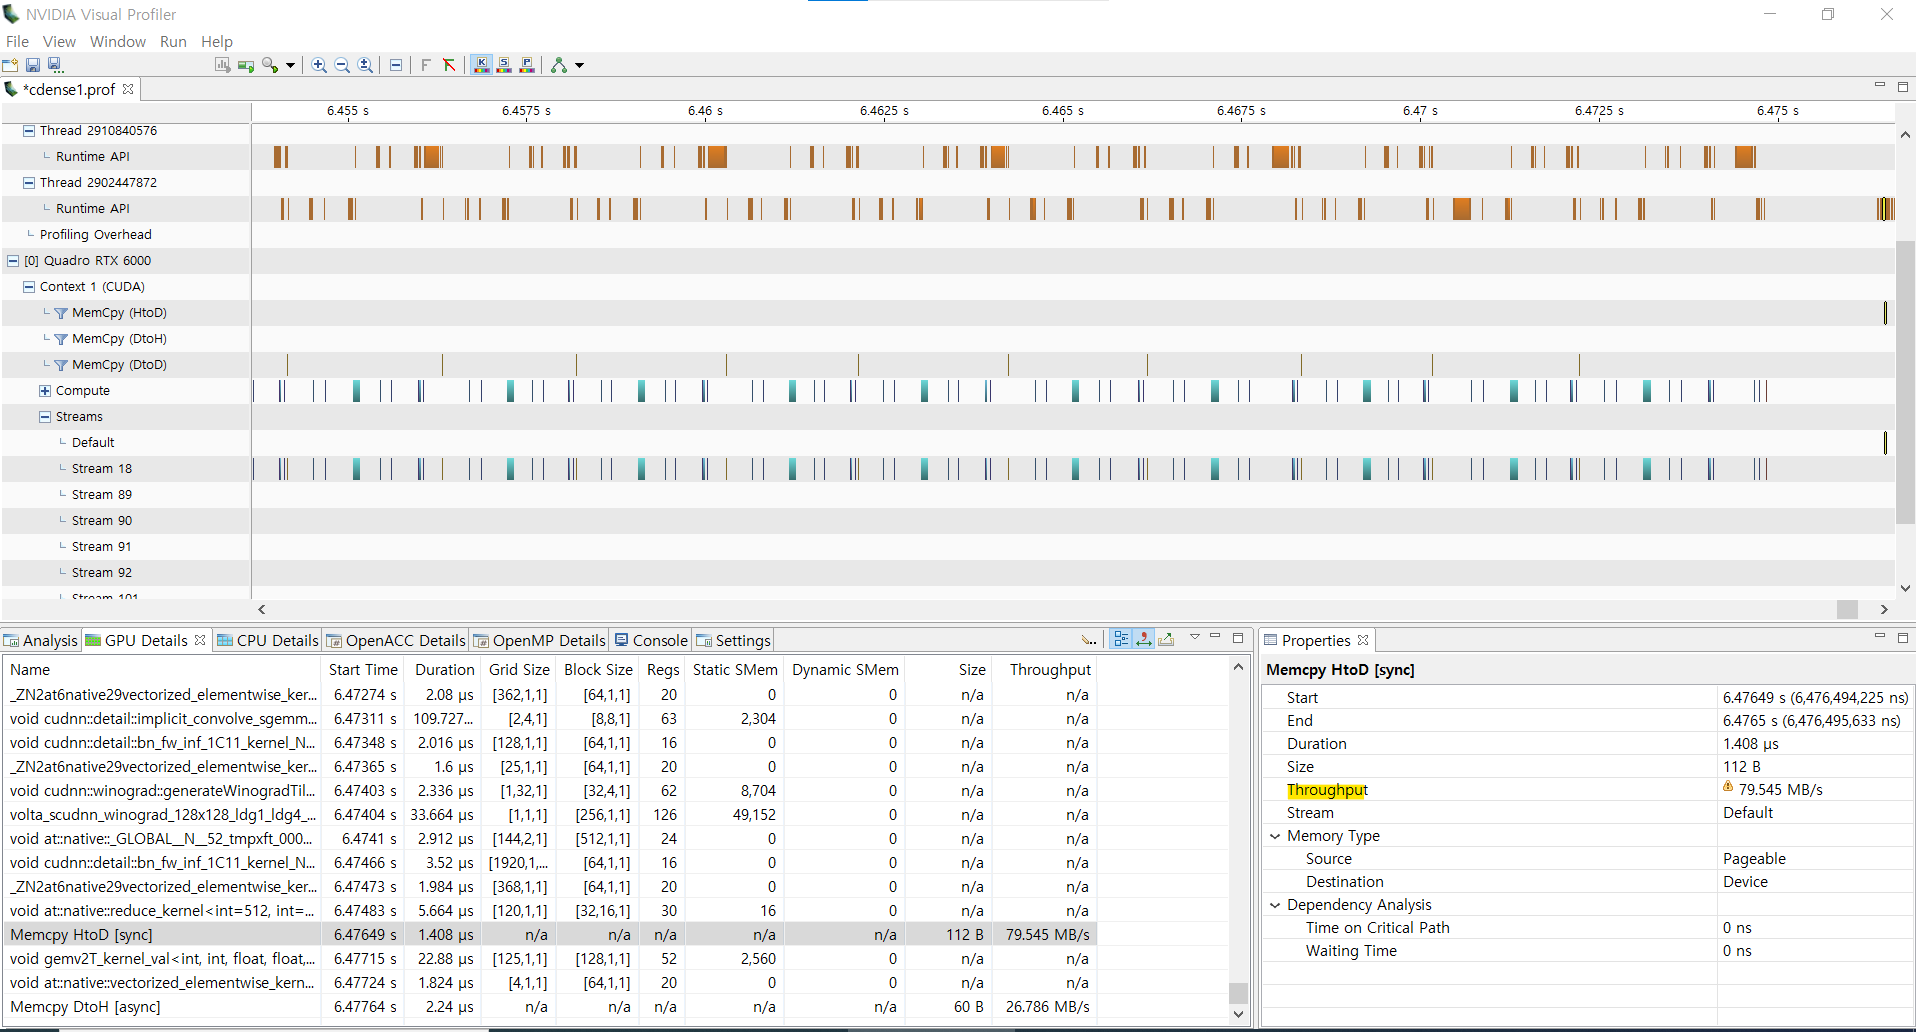
In this picture 'memory ’ means global memory?
And
If the ‘throughput’ is about shared memory, you mean SM to shared memory?Or global memory to shared memory? Or both.
In this picture, ‘Throughput’ is also about shared memory?
Memcpy(HtoD) is Host(DRAM) → Device(global memory) → shared memory but ‘Throughput’ is only about shared memory?
If I have to consider memory contention, can I consider only shared memory, not global memory?
in that picture it means device memory, i.e. the memory attached to the GPU. “global” is properly used as a logical space identifier. The location of global memory is often, but not always, in device memory. Another possible location for it (for example) is system memory (e.g. pinned host memory).
yes, when I was talking about shared memory, I was referring to the transfer path from SM to shared memory.
no, the throughput there is not about shared memory.
Memcpy(HtoD) refers to host(DRAM) to Device(global memory) only.
Ok, Thanks
So, If I want to know one kernel’s ‘effective shared memory bandwith’, which value of the profiler should I look at?
I don’t recommend the NVIDIA Visual profiler for use on RTX 6000. You should use one of the new profilers. For gathering these kinds of metrics, the one to use is nsight compute. This blog should help with learning to use nsight compute and gather metrics (although it doesn’t cover shared memory specifically).
One possible approach (more or less consistent with the approach laid out in the best practices guide you already linked) would be to gather the metrics that track shared memory activity (loads, stores) and then divide that by the timeframe of interest, such as the kernel duration, perhaps. For example you might use the metric for shared load transactions:
l1tex__data_pipe_lsu_wavefronts_mem_shared_op_ld.sum
and there is a similar one for shared store transactions. The previously linked blog will show how to convert these to bytes. You could then divide by your measured kernel duration. However, looking at that metric table, there are already metrics for shared throughput, for example for loads:
l1tex__data_pipe_lsu_wavefronts_mem_shared_op_ld.sum.per_second
So that is probably easier.
I suggest asking detailed profiler usage questions on the forum for whichever profiler you are using.
Thank you for your kind reply.
One more thing.
Is there anything about global memory like getting an effective shared memory?Or a metric?
I don’t know what that means, I’m not able to parse that sentence. However, did you look at the table I previously linked? There are global memory metrics listed there. I also list global memory metrics in the blog I linked.
I want to know the global memory bandwidth that one kernel uses.
Which value should I look at out of the many metrics?
Perhaps these from this table:
dram read throughput:
dram__bytes_read.sum.per_second
dram write throughput:
dram__bytes_write.sum.per_second