We need to verify this with a simpler test.
Random 128-byte gmem loads across a 1.5GB extent would be be a good test.
We need to verify this with a simpler test.
Random 128-byte gmem loads across a 1.5GB extent would be be a good test.
Well that’s what this is more or less meant to be. but there’s a bit of hashing in between too. I could modify the code to be more simple, but it would be best of somebody else would independently write a different kernel that would reproduce the same behavior, or, even better, prove me wrong :)
Yes, I definitely wasn’t critiquing your code but hoped to reproduce your findings. :)
Here’s an implementation that I cranked out this morning. So much for writing a simpler test? :)
I appear to be reproducing your results on a Win7/x64 machine. Great catch by @Genoil!
Under 1GB:
$> probe_bw 0 1024 32
GeForce GTX 980 : 16 MP : 4096 MB
65536 x 512 bytes : 84.44 ms. : 165.80 GB/s

$> probe_bw 2 1024 32
GeForce GTX 750 Ti : 5 MP : 2048 MB
65536 x 512 bytes : 198.07 ms. : 70.68 GB/s   <-- GOOD
Over 1GB:
$> probe_bw 0 1700 32
GeForce GTX 980 : 16 MP : 4096 MB
65536 x 512 bytes : 84.55 ms. : 165.58 GB/s

$> probe_bw 2 1700 32
GeForce GTX 750 Ti : 5 MP : 2048 MB
65536 x 512 bytes : 1187.07 ms. : 11.79 GB/s  <-- BAD
The over-1GB GTX 750 Ti bandwidth numbers are probably higher than your example due to the unrolling that I do in the kernel as well as use of 512-byte transactions.
The 128-byte (32 x 32-bit) version matches the 3 GB/sec. results you were seeing. You can enable this with an edit.
I only tested on a K620 (sm_50), GTX 750 Ti (sm_50) and GTX 980 (sm_52).
I haven’t upgraded to Win10 yet so these are Win7/x64 results on 355.98.
So… this is a distressing result for Maxwell v1.
It would be great for NVIDIA to explain this behavior in detail.
My results on 64-bit Windows 7 Professional, WDDM driver 353.82:
C:>probe_bw 0 1024 32
Quadro K2200 : 5 MP : 4096 MB
65536 x 512 bytes : 228.46 ms. : 61.28 GB/s

C:>probe_bw 2 1024 32
 : 0 MP : 0 MB
65536 x 512 bytes : 226.41 ms. : 61.84 GB/s

C:>probe_bw 0 1700 32
Quadro K2200 : 5 MP : 4096 MB
65536 x 512 bytes : 813.09 ms. : 17.22 GB/s

C:>probe_bw 2 1700 32
 : 0 MP : 0 MB
65536 x 512 bytes : 813.72 ms. : 17.20 GB/s
What’s the first argument to probe_bw? The fact that the device properties are empty when it is 2 suggests it is the device ordinal?
probe_bw: <device-id> <extent mbytes> <probe mbytes>
The arguments are:
All 3 must be provided.
The number of randomized probes per grid launch that will result from argument 3 is reported as “
x 512 bytes”.
The total run time is magnified by arbitrarily chosen loop constants hiding in the code.
For the values 0 1700 32 with Windows 7 Titan X;
GeForce GTX TITAN X : 24 MP : 12287 MB
65536 x 512 bytes : 53.11 ms. : 263.62 GB/s
@CudaaduC, 263 GB/sec! You’re making us all feel inferior. :)
Certainly was not intended that way, just wanted to see if there was an issue with my configuration.
Should mention I built against CUDA 7.5 with driver 355.98 using TCC driver.
In Ubuntu Linux 14.04, running CUDA 6.5, there is a dropoff but it’s quite mild! Still repeatable.
Driver 346.72.
I can only allocate 1600MB successfully, 1700 fails. (Probably due to different static memory use by the X11 driver.) A few rounds of trials and my screen is corrupted, too… I need to reboot.
./probe_bw 0 100 32
GeForce GTX 750 Ti : 5 SM : 2047 MB
65536 x 512 bytes : 191.71 ms. : 73.03 GB/s
./probe_bw 0 1100 32
65536 x 512 bytes : 201.50 ms. : 69.48 GB/s
./probe_bw 0 1200 32
65536 x 512 bytes : 210.30 ms. : 66.57 GB/s
./probe_bw 0 1300 32
65536 x 512 bytes : 217.91 ms. : 64.25 GB/s
./probe_bw 0 1400 32
65536 x 512 bytes : 224.11 ms. : 62.47 GB/s
./probe_bw 0 1500 32
65536 x 512 bytes : 229.36 ms. : 61.04 GB/s
./probe_bw 0 1600 32
65536 x 512 bytes : 235.65 ms. : 59.41 GB/s
Thanks a lot for taking the effort! I’ve filed a bug report referencing this thread about a week ago, but so far it has been quiet.
BTW, a smaller transaction size (128 bytes) matches the 3 GB/s throughput @Genoil was seeing:
$> probe_bw.exe 2 900 128
GeForce GTX 750 Ti : 5 SM : 2048 MB
1048576 x 128 bytes : 794.71 ms. : 70.47 GB/s   <-- GOOD

$> probe_bw.exe 2 1600 128
GeForce GTX 750 Ti : 5 SM : 2048 MB
1048576 x 128 bytes : 17197.76 ms. : 3.26 GB/s  <-- BAD
Set line 20 to ‘0’ to test 128-byte transactions.
Linux degrades by 70%, compared to Windows degrading 96%.
./probe_bw 0 900 128
GeForce GTX 750 Ti : 5 SM : 2047 MB
1048576 x 128 bytes : 799.55 ms. : 70.04 GB/s

./probe_bw 0 1600 128
GeForce GTX 750 Ti : 5 SM : 2047 MB
1048576 x 128 bytes : 2439.03 ms. : 22.96 GB/s
Another data point…
Here’s a plot of a Quadro K620 in both WDDM and TCC mode:

The Quadro K620 is a Maxwell v1 device: sm_50, 3 SMM, GM107 GL-A, 128-bit DDR3 @ 28.8 GB/sec.
Tested with:
$> probe_bw <id> <1024-1700> 32
Checked this on a Windows 7 laptop GTX 980M with a theoretical maximum GBs of 160 GBs(WDDM driver);
1024 32
GeForce GTX 980M : 12 SM : 4096 MB
1835008 x 128 bytes * 64 : 134.19 ms. : 104.33 GB/s
1700 32
GeForce GTX 980M : 12 SM : 4096 MB
1835008 x 128 bytes * 64 : 135.69 ms. : 103.18 GB/s
So it appears that compute 5.2 GPUs do not have this issue?
Correct. No one has reported this issue on an sm_52 device.
I tweaked the probe_bw gist to properly handle a 2GB+ cudaMalloc. Hopefully I got it right.
A headless 4GB GTX 980 (sm_52) rolls off strongly at 2048 MB:
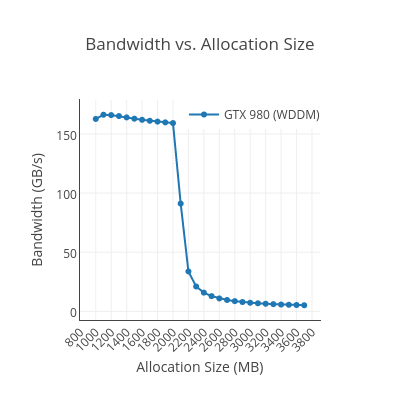
With this new datapoint, I’ll let others make conclusions on where the roll-off will occur relative to total memory. :)
Tested with:
$> probe_bw <id> <1000-3700> 32
Win7/x64 + CUDA 7.5 + 358.50.
I think that was the preliminary conclusion drawn earlier in this thread. The issue manifests on various sm_50 GPUs, but so far nobody has been able to reproduce it on sm_52 GPUs. Although I have an sm_50 GPU in my system, I feel little inclination to dig further.
Without a detailed architectural description it is difficult to zero in on the root cause of the observed behavior. It probably has something to do with how the GPU memory controller is organized internally (partitions, banks, address scrambling), interconnect and buffering between SMs and memory controllers (so there might be some dependence on the number of the SM, although the data collected so far does not show any specific correlation that I can discern), and whether dynamic memory space re-mappings occur under driver control (which could explain the performance differences observed between WDDM and TCC drivers).
Since this is the “CUDA Programming and Performance” forum, I’m waiting for NVIDIA to explain whether this is something to worry about.
What are we actually seeing here? Hopefully it’s not a bug in @Genoil and my tests.
One strong use case for allocating a large slab of segments is implementing a fixed-size block pool allocator. Depending on the pool’s alloc/free access pattern, its free list will eventually become jumbled enough to start looking very similar to the probe_bw test case. A stealthy performance degradation would be a nightmare to debug.
Hello!
I was experiencing similar slow-down issues when operating with large amount of memory on my GTX 980 Ti, specifically when memory allocated block is of size over around 2 giga.
What I also noticed was high bus interface load on PCIE 3.0 x16; even though my algorithm was loading very little data on/off GPU memory.
To me it seems as if part of GPU memory was constantly in sync with CPU memory (that isn’t allocated) - default unified memory?
It’s WDDM!
Under Windows, a GeForce GPU will have its memory managed by a GPU virtual memory manager built into WDDM. A request to cudaMalloc in a WDDM GPU ultimately is making a request into the host OS to allocate a piece of this virtual memory space. WDDM can do demand-paging on GPU memory managed this way.
Read the answer here:
[url]cuda - Understanding concurrency and GPU as a limited resource - Stack Overflow
Archaea Software == Nick Wilt, one of the original designers of CUDA.
I’ve made a reference to this already in this thread. I’m not suggesting it is the only issue being kicked around in this thread, but there is already enough data in this thread to show a clear distinction between behavior under linux and behavior under windows WDDM, for the same GPU type.
allanmac, I compiled your test program and run on my Windows OS. Here are results for 980 Ti:
500M: 170 GB/s
1000M: 163 GB/s
1500M: 169 GB/s
2000M: 169 GB/s
2500M: 19 GB/s
3000M: 11 GB/s
3500M: 8 GB/s
4000M: 4 GB/s
4500M: 4 GB/s
5000M: 4 GB/s
5500M: 4 GB/s
Will try to check bus load now when running these tests…