GPU : NVIDIA GeForce RTX 3060
Driver : Driver Version: 525.85.12
CUDA Version: 12.0 (in nvidia-smi)
TensorRT Version : 8.5.2.2
GStreamer Version : 1.16.3
NSight Version : 2022.4.2
Hi, i want to analyse my gstreamer pipeline in NSight. I put the command line with arguments, selected all checkboxes that i want to analyse (all of them, actually) and waited to see all my elements’ analysis.
But there is only gst-launch-1.0 and qtdemux shown. How can i see all my element’s performance ?
Here is the pipeline :
gst-launch-1.0 filesrc location=/home/ali/Desktop/video/random/e.mp4 ! qtdemux ! avdec_h264 ! nvh264enc ! h264parse ! qtmux ! filesink location= /home/ali/Desktop/gstreamer-toplu/nvh264encli.mp4
.
.
.
Here are the screenshots belong to NSight Analysis’s results:
1-
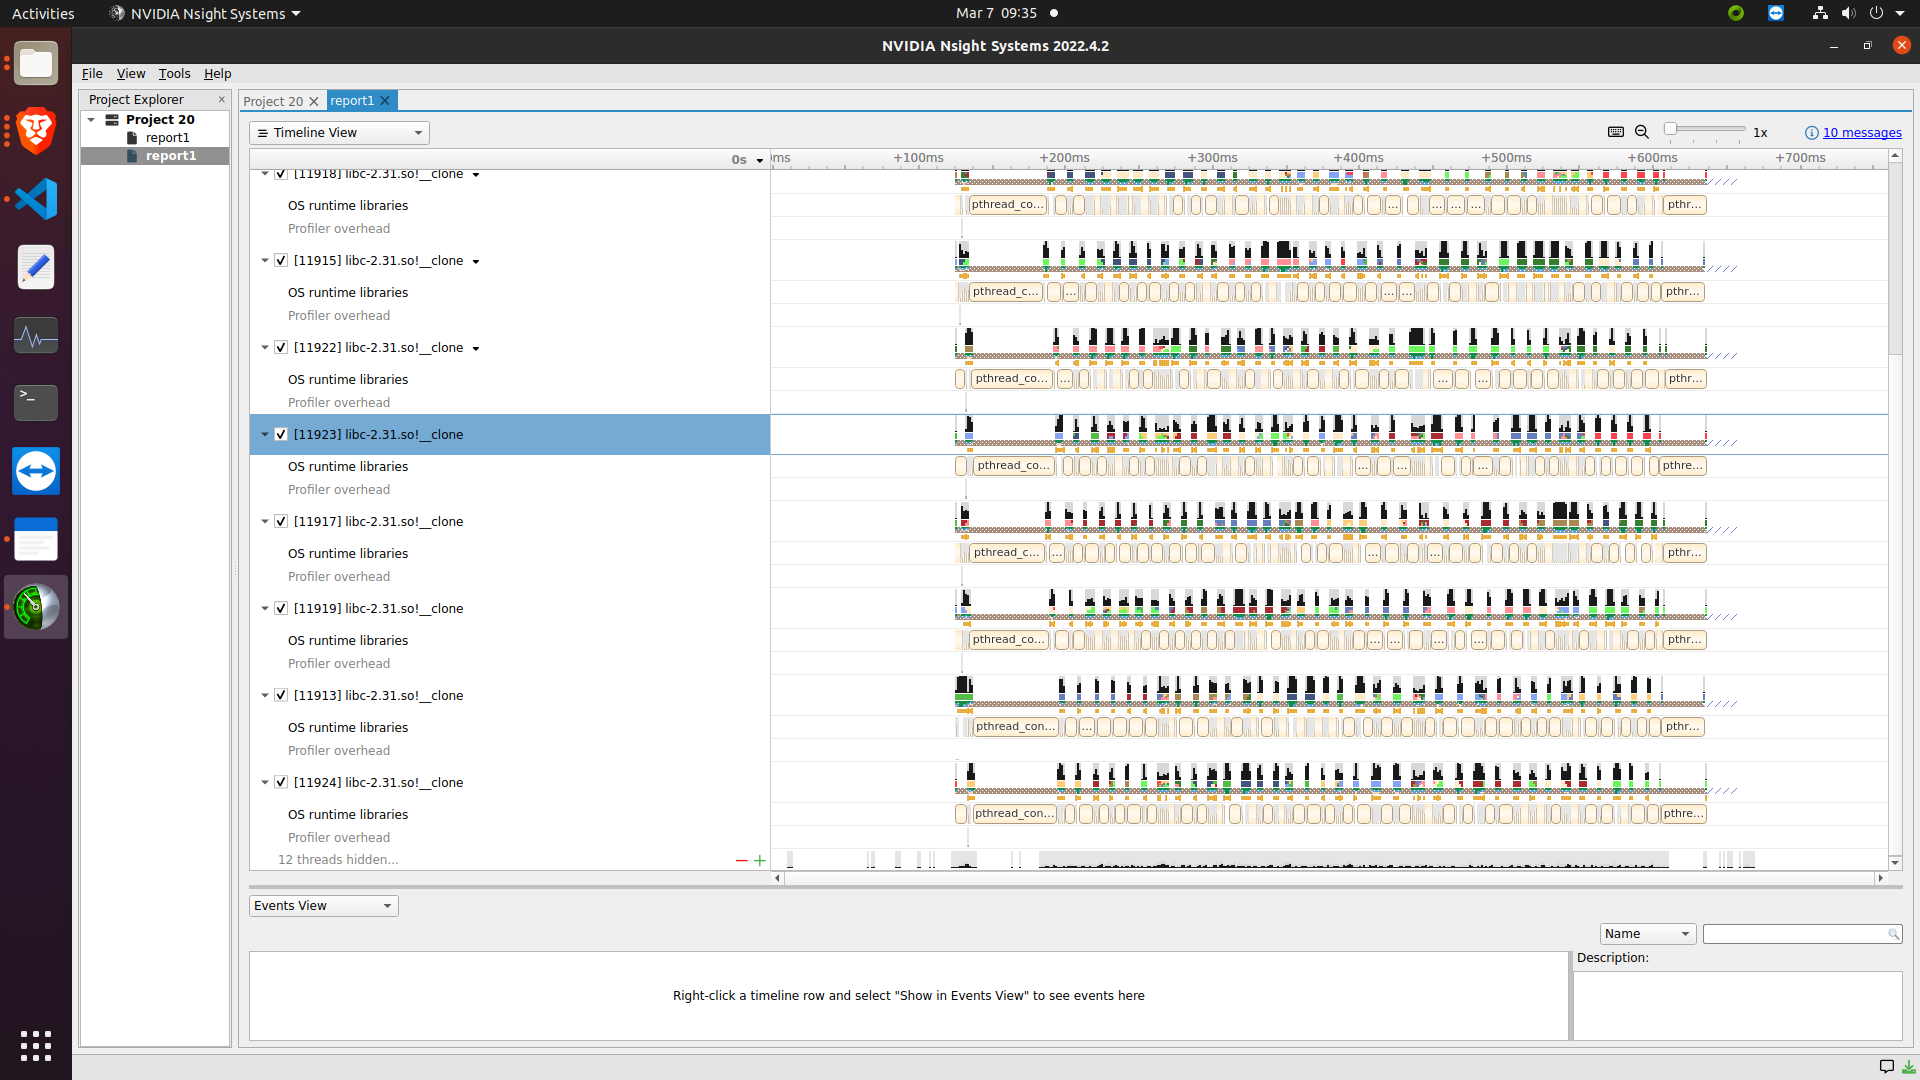
Those are the only two threads with any heavy activity, so they are the only ones that are opened in the timeline by default. You can click on “show hidden rows” to see the other ones.
You could also used the sqlite export to find particular information for named elements.
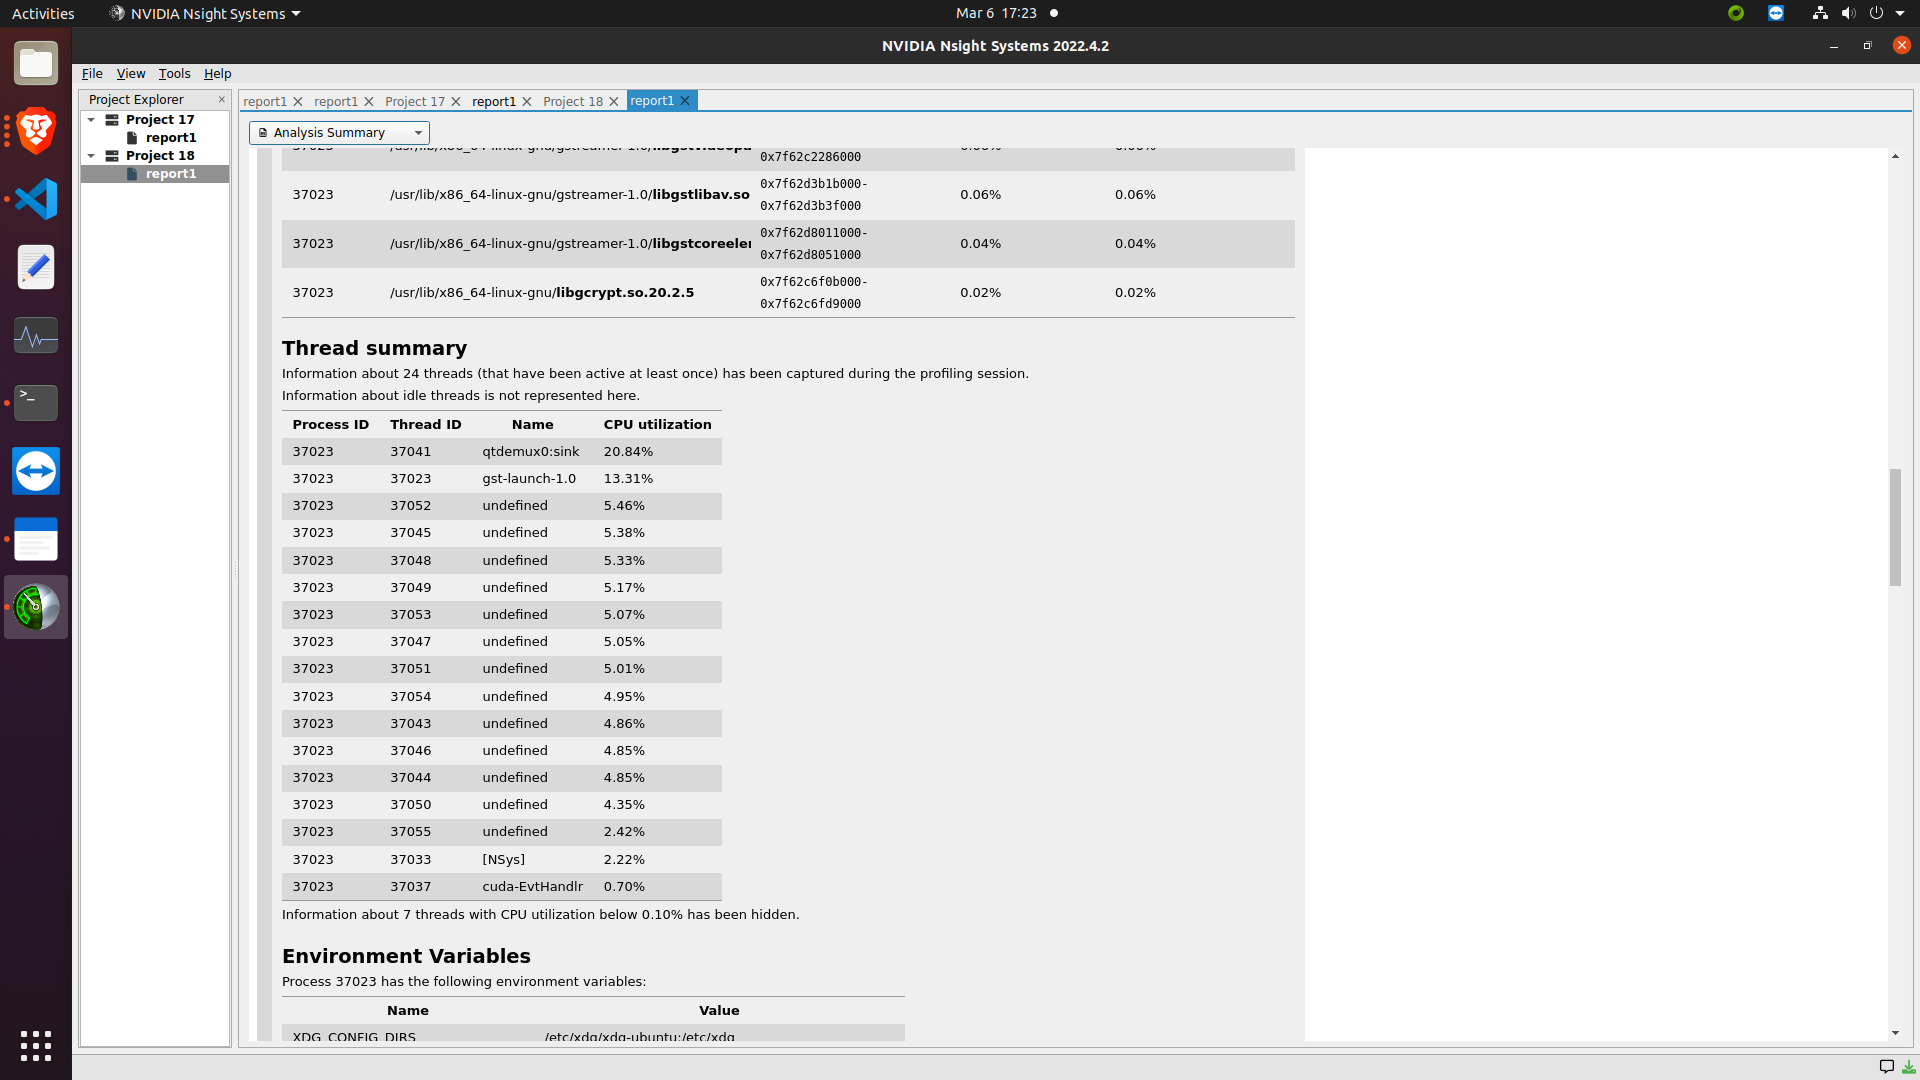
Also, elements should show in Analysis Summary>Thread Summary section but there are just “undefined” elements in there (as i mentioned with screenshot in my first post).
When i tried to export to all types by clicking right click to report 1 button (SQLite, Text, JSON…) i saw the same information with the GUI NSYS report.
How can i track and see all elements? Instead of “undefined”, i want to see element’s name there (And in Timeline View of course.)
Hi ali.bulus, by “elements” do you mean OS threads? Or OS processes? From the screenshot you shared, it looks like the application launched under Nsight Systems had a single OS process with 24 OS threads. Nsys gets the name of the threads from procinfo. It looks like none of the threads had a name. If you would like to name the threads, then you could use nvtxNameOsThread API from the NVTX library and include the NVTX tracing option when profiling the application with Nsight Systems. You will see the name of the OS thread show up on the timeline in Nsight Systems.
If your application is spawning multiple processes, then make sure to check the “include child processes” in the project before profiling.
I also construct my pipeline with python. In “command line with arguments:” section, instead of writing pipeline string i am writing deepstream terminal command to analyze pipeline, I would like to see the plugins there too.
I want to see all of the plugins analysis. (avdec_h264, nvh264enc, h264parse …) I want to see which cpu or gpu is activated and how many seconds it lasted etc. How can i achieve this ?
(i looked up to NVTX but it is complicated. if you say it is the only wayi i will work on it. but wonder if any other way or am i using nsys wrong)
Hey ali.bulus,
Do you know if all the plugins translate to different OS threads in the app? I am not very familiar with gstreamer or deepstream to know this.
If yes, then you can use pthread_setname_np function from the pthread library (or other system APIs) to name the OS threads and the thread names will show up on the timeline.
queue element can be added between elements/plugins to have separate thread for each elements, right now everything is processed sequentially on demux thread