Hello
I’m having trouble understanding why when plotting the roofline chart on compute for a kernel running on an A100, the FP64 peak performance boundary is set at around 7.5 TFLOP/s (V100 peak) and not around the actual 9.5 TFLOP/s it should use as limit. I’m attaching a screenshot from an analysis on my kernel. You can see the tool correctly identifies the A100 GPU but the peak performance as I hover over the plateau is wrong. I’m using Nsight compute version 2021.3. I tried this on version 2022.2 but when I hover over the boundaries the pop-up tooltip is not working (Linux version).
Is there something wrong here or does it set the peak performance as 7.5 because that’s the nominal peak and not the theoretical?
Thanks for your help.
The roofline is constructed based on the clock rate at which the application was run (because that sets the upper limit).
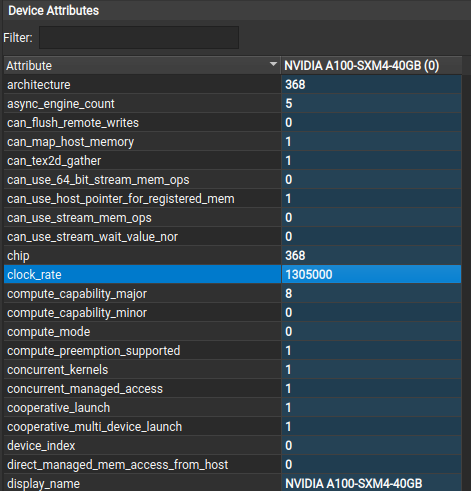
What is the clock_rate for your profiling run? You can find this under Device Attributes on the Session page in the Nsight Compute UI.
Thanks for the answer @Sanjiv.Satoor , I’m really interested in correctly interpreting this chart. The reported clock_rate for my A100 was: 1305000
How is that clock_rate used to compute the FP boundary? Could you share that formula? I’m guessing the 9.5 TFLOP/s peak would then require some GPU Boost Clock?
I’ve figured it out. This has to do with the clock control option on Nsight Compute and the default application clock that’s set on the A100 I’m running on (1305 MHz). I should then set the clock rate through nvidia-smi and then profile the application with no clock control.
However, this still doesn’t add up the 7.5 TFLOP/s boundary that plot is showing. How is that peak boundary computed using the clock rate?
