Hi, I’m trying to profile DNN training and inferencing models on an Nvidia Orin. But, I’m observing the following issues when I generate a kernexectrace report from Nsight systems :
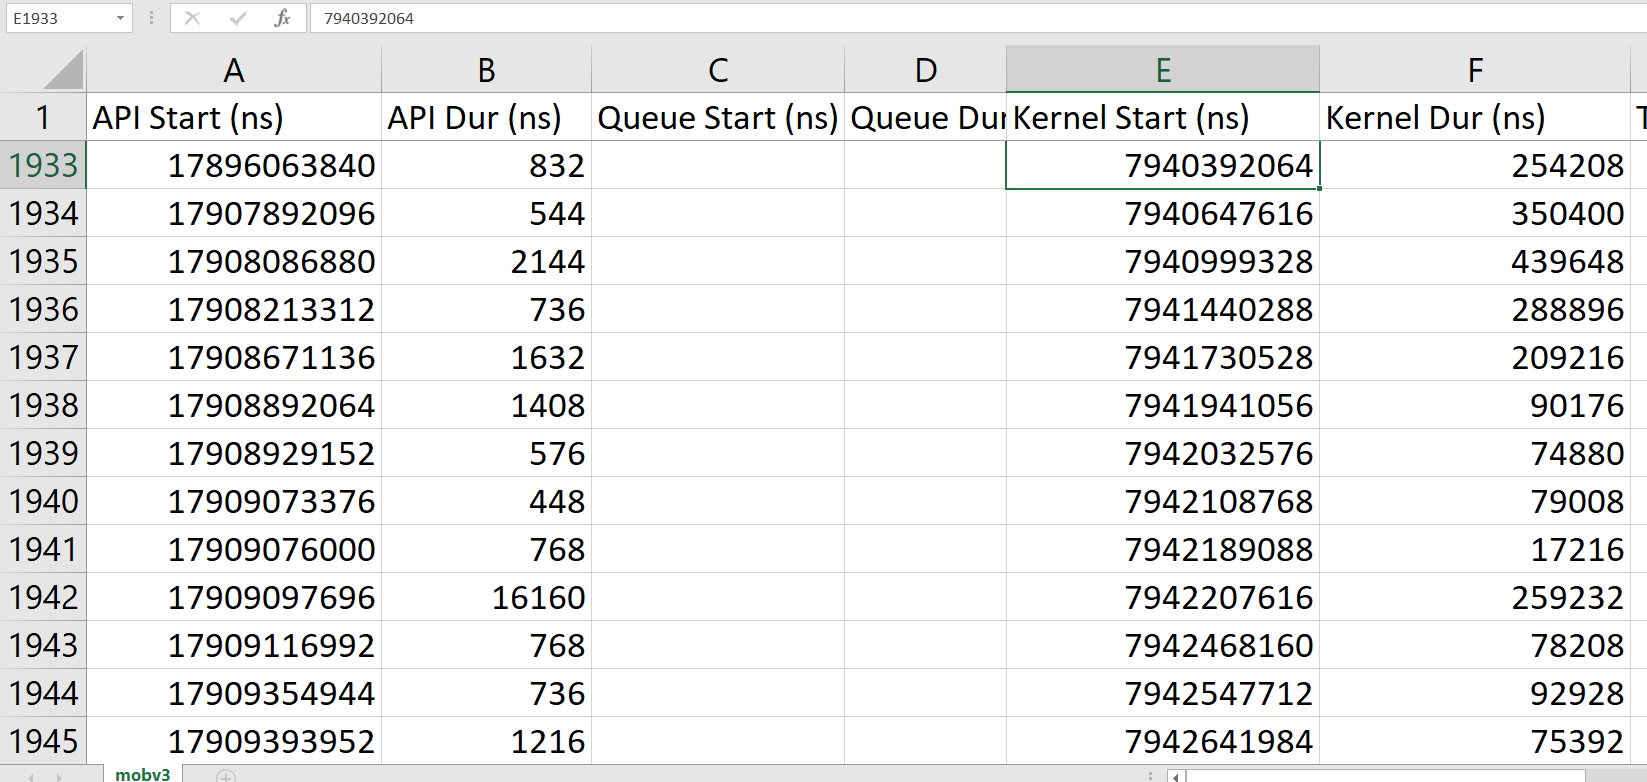
- The kernel start time is less than the API start time in some cases. Please refer the below screenshot for the documentation of the “kernexectrace” report.
As evident from the docs, the API start should always be lesser than the kernel start time since the CUDA API invokes the kernel. But, in the report generated by Nsight, the kernel start is less than the API start time.
What could be the reason for this ? Are they both measured using different clocks ? Or is it the case that API Start doesnot actually indicate the start time of the CUDA API ?
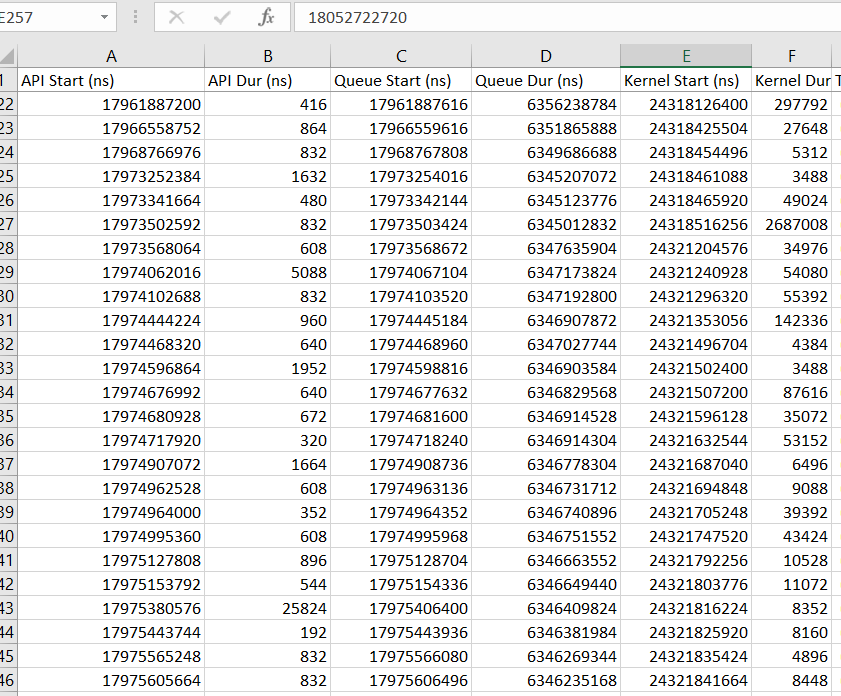
- I’m observing a very large queuing Duration time. And the kernel for the API starts several seconds after the API is invoked. I’m not able to figure out why this could be ? Are these kernels not part of the ones that are launched in the DNN workload ?
Please find the screenshot below in which the kernel starts several seconds after the API call is made:
Thanks a lot !
Hello, please let me know if you have any updates on this. Thanks !
Hello vinayakah,
For the first problem, the timestamps for the API calls and the kernel execution are captured from different time domains (CPU clock vs GPU PTIMER) and converted to a common time domain. We have had some bugs in the past on the time conversion logic. Could you please tell me which target platform and OS you are profiling on and what is the output of nvidia-smi and nsys --version? Please share the report file where you see this bug, if you can.
For the second problem, it is hard to say why there is a long latency between API call and the kernel execution on the GPU. Could you share the report file? It is possible that the GPU is busy executing other kernels or operations and it takes some time to get to the kernel in question.
1 Like
Hi @skottapalli , thanks for the reply. Please find the details below :
Target platform : Nvidia Orin AGX
Jetpack version : 5.0.1-b118
OS : Ubuntu 20.04.4 LTS (Focal Fossa)
Nsys version : 2022.2.3.16-dc64487
Please find the corresponding report file :
conc_mobv3.csv (831.5 KB)
For the 2nd one, the report file is attached below :
conc_resnet50.csv (389.8 KB)
Also, attached is the nsys.rep file corresponding to the above reports
Report New.rar
Hello, please let me know if you have any updates on this. Thanks !
Those do not look like Nsight Systems report files. @skottapalli do you know if we have seen CPU/GPU clock issues on Orin? Or you can pass this issue to someone else.
@hwilper these are the kerexectrace report log files generated from a nisght run using the nsys cli.
@vinayakah - the nsys-rep file you shared does not seem to correspond to the csv files you shared and it is not showing any kernels as starting before the corresponding API calls. Could you please share the nsys-rep file that shows the problem along with the csv files from the kernexectrace report?