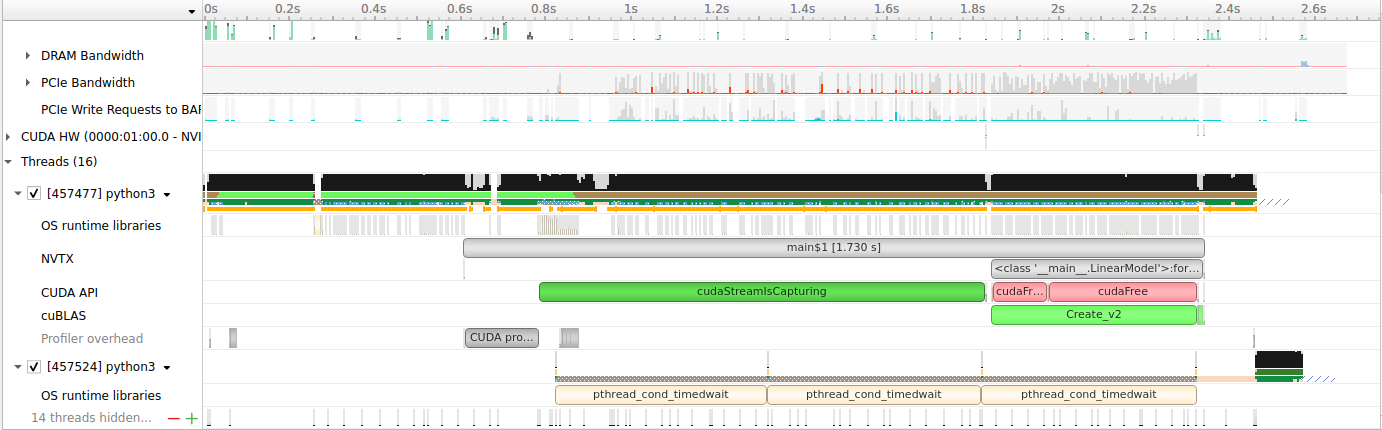
I am using nvtx to annotate regions of the timeline in nsight systems to understand better the nature of the application I am profiling. I noticed that nsight systems provides a good view of the nvtx ranges spatially identifying where the gpu was idling, busy, had poor utilisation. Each nvtx range also has a duration. I wanted to know what the duration exactly means.
An example timeline
This is the abstraction I used to explain the duration of an nvtx range. NVTX annotations don’t make any changes. It is up to the profiler tool to choose how to deal with the nvtx ranges. When we run the application through nsys profiler tool, the nvtxRange* calls are tracked at the CUDA driver abstraction. So when rangePush is called, the CUDA driver logs when that happens. In a similar fashion it will log a rangePop after all the kernels submitted after the last rangePush finish their execution.
Is this understanding of mine correct? If not, what is the right model to have in mind to explain duration of nvtx ranges?
As an example, lets say I have the following code snippet
rangePush()
cpu1
gpu1
cpu2
rangePop()
Now lets say rangePush was logged at the CUDA Driver at 10s. Lets say cpu1(A CPU only routine) takes 1s, the CPU calls gpu1(a GPU kernel) at 11s. Since the kernel launch is asynchronous( the host CPU thread does not wait for gpu1 to finish), the CPU starts executing cpu2 at 11s 400ms, and finishes executing cpu2 at 13s. The rangePop is logged at the CUDA Driver at 13s. Now the nvtx duration will be 13s - 10s = 3s even though gpu1 took only 1s to execute on the GPU.
Thanks