Hello,
I am trying to time a cudnn convolution operation (through PyTorch), using torch.cudnn_convolution. I am using cuda events to time the convolution operation. I have noticed that the frequency with which I refresh the convolution data (input and kernel) impacts the timing of the operation. This seems weird, as the only things between the CUDA events is the convolution itself. Would you have any idea of why this is?
I know this might be a pytorch issue, but (i) they have been quite unresponsive on their forums (ii) pytorch binds cuda events and cudnn events directly, so this also concerns Nvidia.
Below is the figures drawn to show this phenomenon (I have observed it, with various intensities, on various GPUs but I am limited to one image in this post) and the code used to draw it.
Windows, Torch 1.11.0, Cuda 11.3, RTX 3070 Laptop
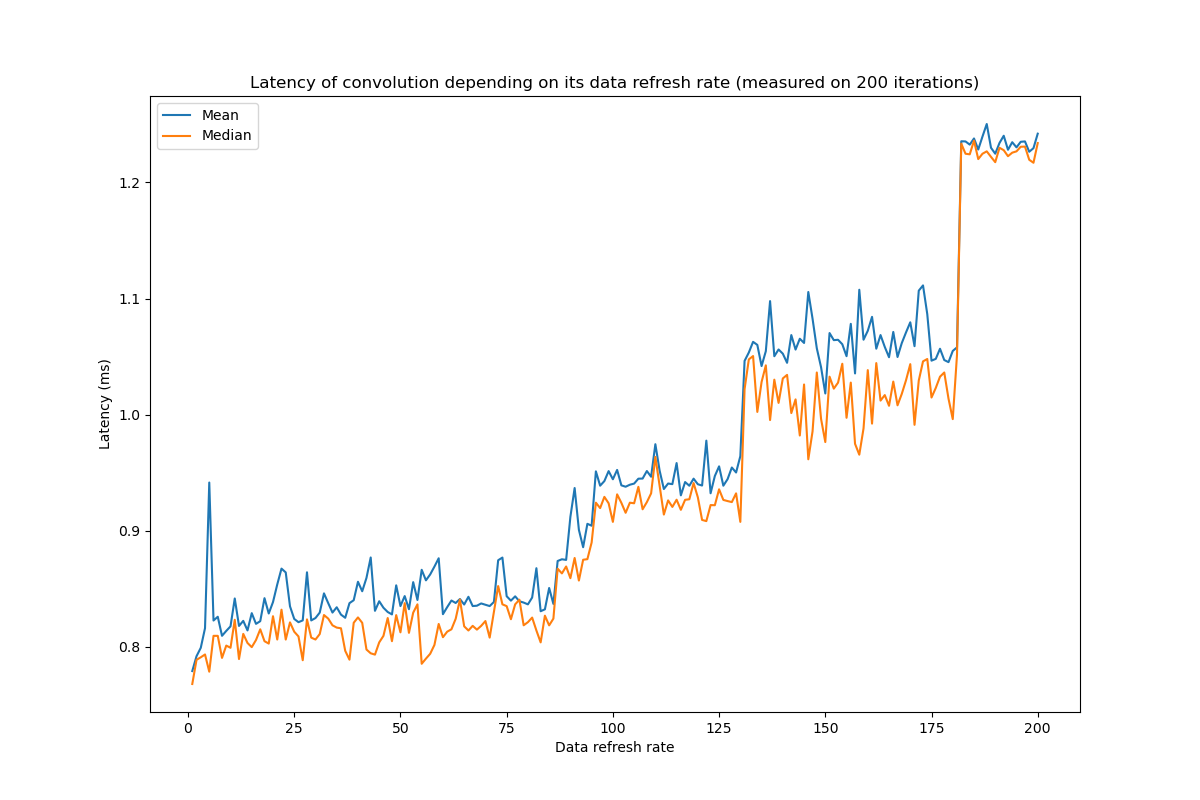
Linux and torch 1.13.1+cu117 and A100
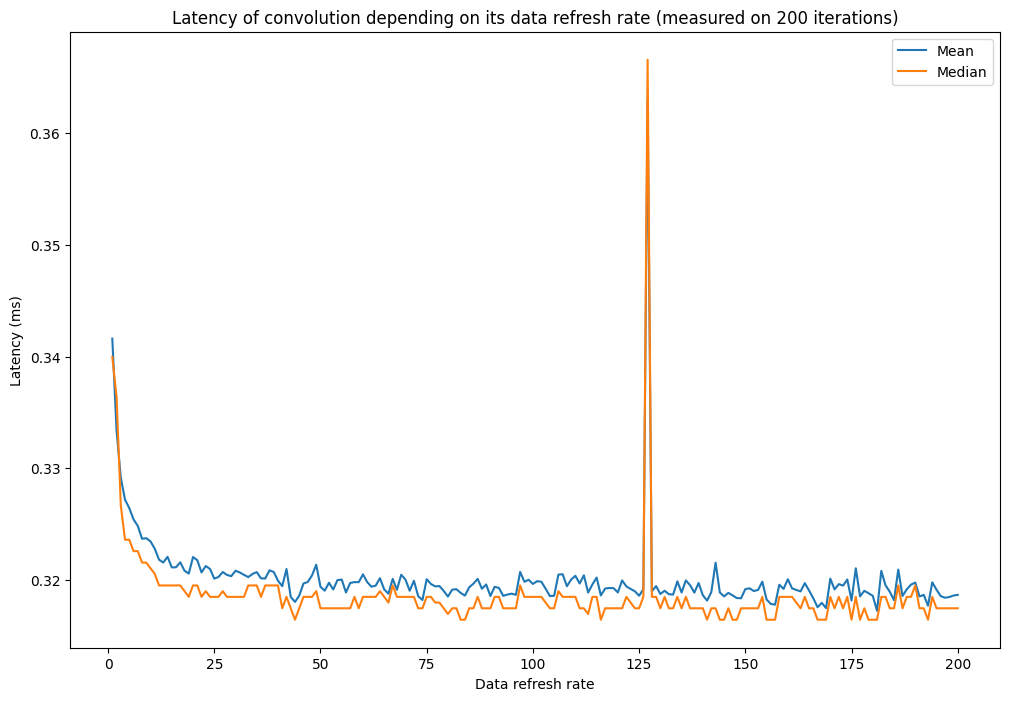
Last figure, linux, torch 1.13.1+cu117, RTX3060
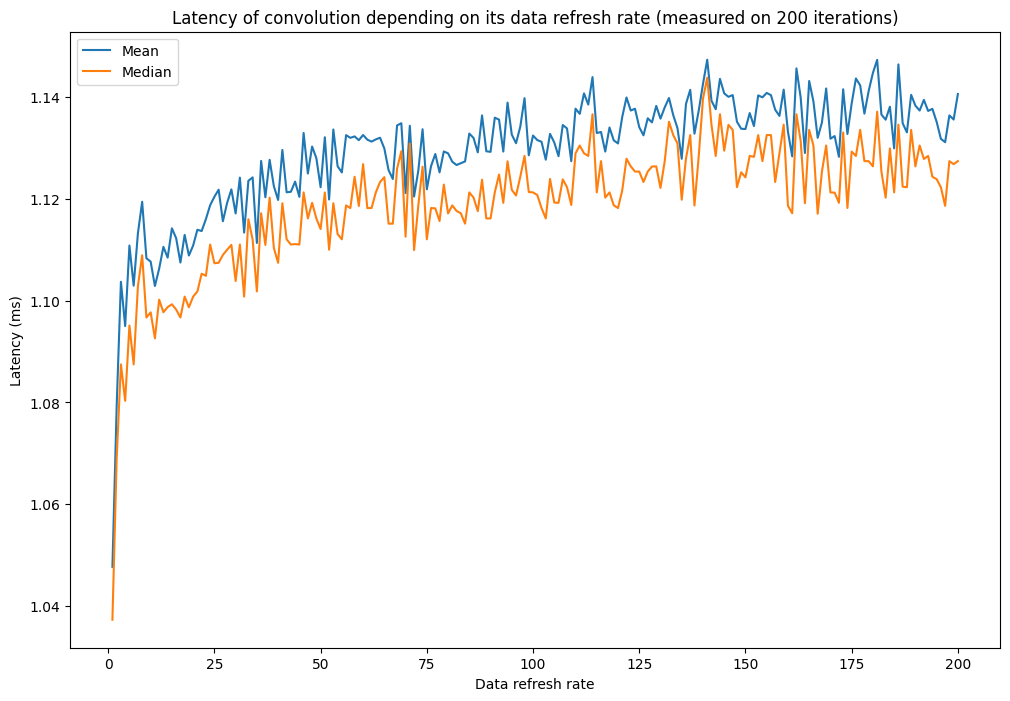
## Imports
from typing import *
import torch
from tqdm.auto import trange
import numpy as np
from torch import Tensor
from torch.cuda import Event
from torch.backends import cudnn
import matplotlib.pyplot as plt


## Constants for convolution / data
BATCH_SIZE = 32
OUT_CHANNELS = 16
FM_SIZE = 64
KERNEL_SIZE = 3

cudnn_convolution_kwargs = dict(
    padding=(1, 1), stride=(1, 1), dilation=(1, 1), groups=1,
    benchmark=True, deterministic=True, allow_tf32=True
)


## Functions
def generate_data() -> Tuple[Tensor, Tensor]:
    # Generate ImageNet-like input
    x = torch.normal(mean=0, std=1, size=(BATCH_SIZE, 3, 224, 224), device='cuda')
    x *= torch.tensor((0.229, 0.224, 0.225), device='cuda').reshape((1, 3, 1, 1))
    x += torch.tensor((0.485, 0.456, 0.406), device='cuda').reshape((1, 3, 1, 1))
    # Generate properly initialized convolution weight
    w = torch.zeros((OUT_CHANNELS, 3, KERNEL_SIZE, KERNEL_SIZE), device='cuda')
    torch.nn.init.xavier_normal_(w)
    return x, w

def time_convolution(iters: int,
                     op_per_iter: int,
                     data_refresh_rate: int,
                     warmup_duration: int,
                     ) -> List[float]:
    cudnn.benchmark = True
    times = []
    # Warmup
    x, w = generate_data()
    for i in range(warmup_duration):
        torch.cudnn_convolution(x, w, **cudnn_convolution_kwargs)
    # Timing loop
    for i in range(iters):
        # Refresh data if needed
        if not i % data_refresh_rate:
            x, w = generate_data()
        # Launch timing
        start, end = Event(True), Event(True)
        torch.cuda.synchronize()
        start.record()
        # Operation loop
        for j in range(op_per_iter):
            torch.cudnn_convolution(x, w, **cudnn_convolution_kwargs)
        # End timing
        end.record()
        end.synchronize()
        times.append(start.elapsed_time(end) / op_per_iter)
    return times


## Script
if __name__ == '__main__':

    # Runtime constants
    ITERS = 200
    WARMUP = 1000

    # Accumulators
    drrs: List[int] = []
    means: List[float] = []
    medians: List[float] = []

    # Data-gathering loop
    for drr in trange(1, ITERS+1):
        ts = time_convolution(iters=ITERS, op_per_iter=1,
                            data_refresh_rate=drr, warmup_duration=WARMUP)
        drrs.append(drr)
        means.append(np.mean(ts))
        medians.append(np.median(ts))

    # Figure
    fig, ax = plt.subplots(1, 1, figsize=(12, 8))
    ax.plot(drrs, means, label='Mean')
    ax.plot(drrs, medians, label='Median')
    ax.set_title('Latency of convolution depending on its data refresh rate '
                 f"(measured on {ITERS} iterations)")
    ax.set_xlabel('Data refresh rate')
    ax.set_ylabel('Latency (ms)')
    ax.legend()
    plt.savefig('__tmp__.png')
    plt.show()