Hi,
I’m using the gdsio benchmark to evaluate the performance of GPU Direct Storage (GDS) with a 4K random read workload. I observed that the average latency in ASYNC mode is significantly higher than in SYNC mode. I’m wondering whether this is expected behavior.
Hardware Setup
- CPU: INTEL(R) XEON(R) GOLD 6526Y, 64 cores
- GPU: NVIDIA A100-SXM4-40GB
- SSD: SAMSUNG MZQL21T9HCJR-00A07, local
- GPU and SSD are on the same numa node (1)
Software Setup
- Ubuntu 22.04, Linux kernel 5.15.0
- MLNX_OFED: MLNX_OFED_LINUX-24.10-1.1.4.0-ubuntu22.04-x86_64
- cuda 12.2
- GDS release version: 1.11.1.6
- nvidia_fs version: 2.22
- libcufile version: 2.12
- Platform: x86_64
- Nvidia: 535.247.01
Here is the output of gdscheck
$ sudo ./gdscheck -p
 GDS release version: 1.11.1.6
 nvidia_fs version:  2.22 libcufile version: 2.12
 Platform: x86_64
 ============
 ENVIRONMENT:
 ============
 =====================
 DRIVER CONFIGURATION:
 =====================
 NVMe               : Supported
 NVMeOF             : Supported
 SCSI               : Unsupported
 ScaleFlux CSD      : Unsupported
 NVMesh             : Unsupported
 DDN EXAScaler      : Unsupported
 IBM Spectrum Scale : Unsupported
 NFS                : Unsupported
 BeeGFS             : Unsupported
 WekaFS             : Supported
 Userspace RDMA     : Supported
 --Mellanox PeerDirect : Enabled
 --rdma library        : Loaded (libcufile_rdma.so)
 --rdma devices        : Configured
 --rdma_device_status  : Up: 1 Down: 0
 =====================
 CUFILE CONFIGURATION:
 =====================
 properties.use_compat_mode : true
 properties.force_compat_mode : false
 properties.gds_rdma_write_support : true
 properties.use_poll_mode : true
 properties.poll_mode_max_size_kb : 4
 properties.max_batch_io_size : 128
 properties.max_batch_io_timeout_msecs : 5
 properties.max_direct_io_size_kb : 16384
 properties.max_device_cache_size_kb : 131072
 properties.max_device_pinned_mem_size_kb : 33554432
 properties.posix_pool_slab_size_kb : 4 1024 16384
 properties.posix_pool_slab_count : 128 64 32
 properties.rdma_peer_affinity_policy : RoundRobin
 properties.rdma_dynamic_routing : 0
 fs.generic.posix_unaligned_writes : false
 fs.lustre.posix_gds_min_kb: 0
 fs.beegfs.posix_gds_min_kb: 0
 fs.weka.rdma_write_support: false
 fs.gpfs.gds_write_support: false
 profile.nvtx : false
 profile.cufile_stats : 0
 miscellaneous.api_check_aggressive : false
 execution.max_io_threads : 4
 execution.max_io_queue_depth : 128
 execution.parallel_io : true
 execution.min_io_threshold_size_kb : 8192
 execution.max_request_parallelism : 4
 properties.force_odirect_mode : false
 properties.prefer_iouring : false
 =========
 GPU INFO:
 =========
 GPU index 0 NVIDIA A100-SXM4-40GB bar:1 bar size (MiB):65536 supports GDS, IOMMU State: Disabled
 ==============
 PLATFORM INFO:
 ==============
 IOMMU: disabled
 Nvidia Driver Info Status: Supported only on (nvidia-fs version <= 2.17.4)
 Cuda Driver Version Installed:  12020
 Platform: R283-S93-AAF1-000, Arch: x86_64(Linux 5.15.134)
 Platform verification succeeded
Experiments
Storage → GPU (SYNC)
$ sudo ./gdsio -f /mnt/nvme_ext4/32GFile -d 0 -n 1 -w 1 -i 4K -I 2 -x 0 -T 20

IoType: RANDREAD XferType: GPUD Threads: 1 DataSetSize: 1072852/4(KiB) IOSize: 4(KiB) Throughput: 0.052870 GiB/sec, Avg_Latency: 72.151905 usecs ops: 268213 total_time 19.352230 secs

$ sudo ./gdsio -f /mnt/nvme_ext4/32GFile -d 0 -n 1 -w 1 -i 4K -I 2 -x 0 -T 20 -s 32G

IoType: RANDREAD XferType: GPUD Threads: 1 DataSetSize: 812696/33554432(KiB) IOSize: 4(KiB) Throughput: 0.038563 GiB/sec, Avg_Latency: 98.920999 usecs ops: 203174 total_time 20.098367 secs
Storage → CPU
$ sudo ./gdsio -f /mnt/nvme_ext4/32GFile -d 0 -n 1 -w 1 -i 4K -I 2 -x 1 -T 20

IoType: RANDREAD XferType: CPUONLY Threads: 1 DataSetSize: 1290988/4(KiB) IOSize: 4(KiB) Throughput: 0.064274 GiB/sec, Avg_Latency: 59.350699 usecs ops: 322747 total_time 19.155352 secs

$ sudo ./gdsio -f /mnt/nvme_ext4/32GFile -d 0 -n 1 -w 1 -i 4K -I 2 -x 1 -T 20 -s 32G

IoType: RANDREAD XferType: CPUONLY Threads: 1 DataSetSize: 1245260/33554432(KiB) IOSize: 4(KiB) Throughput: 0.060835 GiB/sec, Avg_Latency: 62.705600 usecs ops: 311315 total_time 19.521306 secs
Observations
In SYNC mode, increasing the dataset size significantly increases latency in GPU mode (~+26 µs), but the effect is marginal in CPU mode.
Storage → GPU (ASYNC)
$ sudo ./gdsio -f /mnt/nvme_ext4/32GFile -d 0 -n 1 -w 1 -i 4K -I 2 -x 5 -T 20

IoType: RANDREAD XferType: ASYNC Threads: 1 DataSetSize: 525232/4(KiB) IOSize: 4(KiB) Throughput: 0.025580 GiB/sec, Avg_Latency: 149.071854 usecs ops: 131308 total_time 19.581467 secs

$ sudo ./gdsio -f /mnt/nvme_ext4/32GFile -d 0 -n 1 -w 1 -i 4K -I 2 -x 5 -T 20 -s 32G

IoType: RANDREAD XferType: ASYNC Threads: 1 DataSetSize: 524320/33554432(KiB) IOSize: 4(KiB) Throughput: 0.025199 GiB/sec, Avg_Latency: 151.330340 usecs ops: 131080 total_time 19.843498 secs
Observations
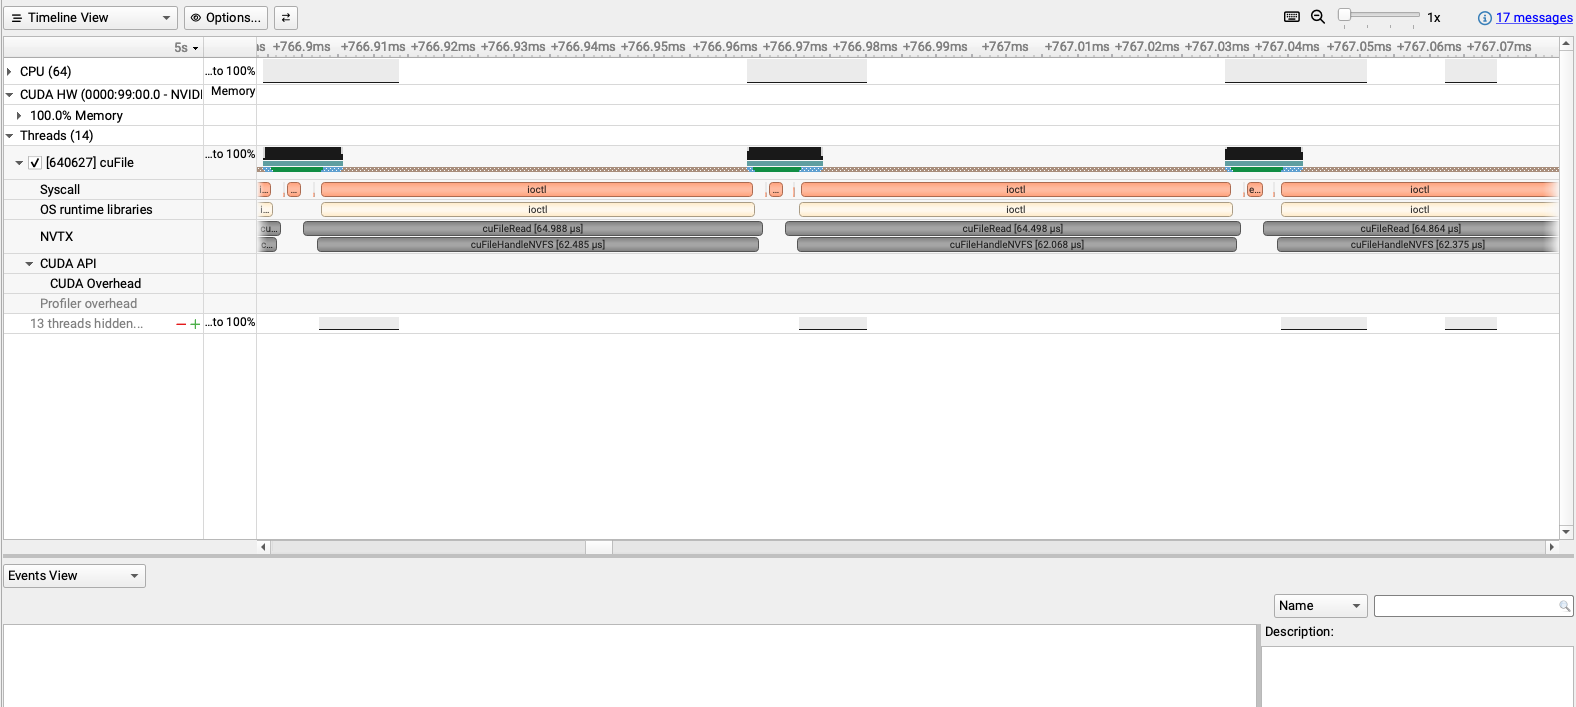
Compared to SYNC mode (~72 µs), ASYNC mode shows more than double the latency (~149 µs). This implies ~70 µs of additional overhead introduced by the asynchronous APIs.
I also checked the cufile.log file in the same directory while running the command in all experiments, and it was empty. I think this suggests that the GDS I/O path is functioning correctly.
Questions
- Is the ~2× latency increase when using ASYNC mode a known or expected behavior with GDS for small block sizes (4K)?
- Why does increasing dataset size lead to larger latency in Storage → GPU SYNC mode?