I am trying to optimize my code using cudaMallocAsync and cudaFreeAsync .
After profiling with Nsight Systems, it appears that these operations are using the local memory pool.
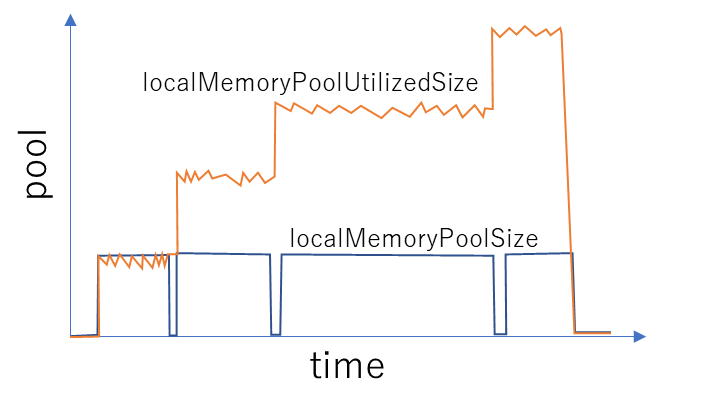
While cudaMemPoolTrimTo is able to release the localMemoryPoolSize , the localMemoryPoolUtilizedSize continues to increase.
My question is, “What does localMemoryPoolUtilizedSize represent?”
As an experiment, I checked the GPU memory using the resource monitor in the task manager, but I did not observe any continuous increase in memory usage, similar to what was observed with the localMemoryPoolUtilizedSize in the profiling results.
Hi, Hope you are doing well.
Currently we are trying to visualize, time vs GPU memory usage
And we are kind of getting these data from nsys.
We have the same question? If you have known the detail please let us know.
@skottapalli can you comment?
@aktcse14 and @tommyecguitar - could you please share a nsys-rep file that shows this behavior? I need to take a look to see if this is expected or a bug.
Thank you for replying to my question from 3 years ago.
I don’t have the profiler data anymore.
But I must have been using CUDA 11.4 or 12.x when I posted this topic.
The Nsight version should be appropriate for that.
@skottapalli Do you have any nsys data?
It looks like the team missed answering to your message from 3 years ago. It popped up again today when another customer asked a question on this thread.
I am not sure what you mean by nsys data. The nsys-rep file is the report created by nsys and it will help me understand if the behavior you saw is a bug in nsys. If you run into this problem again, please share the report file.
According to the CUDA docs, the cudaMemPoolTrimTo - Releases memory back to the OS until the pool contains fewer than minBytesToKeep reserved bytes, or there is no more memory that the allocator can safely release. The allocator cannot release OS allocations that back outstanding asynchronous allocations. The OS allocations may happen at different granularity from the user allocations. Allocations that have not been freed count as outstanding. Allocations that have been asynchronously freed but whose completion has not been observed on the host (eg. by a synchronize) can count as outstanding
The localMemoryPoolUtilizedSize at a given point in time reported by nsys is the amount of memory that is in use at that time. The outstanding allocations that have not been freed or that have been freed asynchronously count towards the utilizedSize.
Sorry, I intended to reply to @aktcse14 , but I mentioned @skottapalli .
Since you were kind enough to respond, I would like to ask a follow-up question to confirm my understanding.
If memory freed by cudaFreeAsync is not synchronized using cudaDeviceSynchronize, cudaStreamSynchronize, or similar calls, it may be treated as an outstanding allocation and therefore appear in localMemoryPoolUtilizedSize.
Is my understanding correct that once a synchronization point is reached somewhere, those memory frees are observed on the host side and will then be reflected in localMemoryPoolUtilizedSize?
Also, from the perspective of the GPU’s physical memory, does the continuously increasing localMemoryPoolUtilizedSize not put pressure on future memory allocations?
Thank you for the reply.
@tommyecguitar, @skottapalli @hwilper
I am not totally sure.
What I am trying to do is plot ( x axis time, y axis -GPU utilization)
for some reason there is no simple support for that.
Although nsys seems to be collecting everything
I am using this as a guide: User Guide — nsight-systems 2025.1 documentation
the 2026 version has a recipe as:
nsys recipe gpu_vram_usage_trace --input [report file path]
Not totally sure when the cached allocation is freed from GPU.
I was trying to know the difference between these 2, `localMemoryPoolUtilizedSize` ,`localMemoryTotal`.
Thank you.
1 Like
I believe that is true.
What I am trying to do is plot ( x axis time, y axis -GPU utilization)
for some reason there is no simple support for that.
Although nsys seems to be collecting everything
@aktcse14 - please see the screenshot below. You should be able to see the blue graph in the timeline view. It is an aggregate row which roughly represents CUDA GPU utilization in terms of CUDA kernel coverage. Is this what you are looking for?
from the perspective of the GPU’s physical memory, does the continuously increasing localMemoryPoolUtilizedSize not put pressure on future memory allocations?
The increasing localMemoryPoolUtilizedSize may be due to the asynchronous memory allocations that were scheduled, but not executed yet. If so, those will not be released by cudaMemoryPoolTrimTo and they will be treated as outstanding i.e. it counts towards the memory in use from the memory pool. If you are trying to do future memory allocations from the pool, then it would reduce the memory available for such allocations, yes.
@skottapalli
Thank you for the reply, but what I am getting is this
It has nothing in the top GPU A100 row.
Can you share the report file? You might want to scroll down to find the CUDA kernels and see the aggregate row for it. Your screenshot shows GPU metrics only and the top-level row for it.