Below is profile result of restnet_50 running on DLA profiled by TensorRT. If use --int8, total latency is about 1.7ms, but with –fp16it takes 17ms. The only diffrence is with–fp16enabled, it has a process calledfc1000 to nvm. And fc1000`is last node of the model. So what is nvm, and why it takes so long to copy data from nvm?
[03/01/2023-11:45:20] [I]                          Layer   Time (ms)   Avg. Time (ms)   Time %
[03/01/2023-11:45:20] [I]                    data to nvm       15.52           0.0862      0.5
[03/01/2023-11:45:20] [I]  {ForeignNode[conv1...fc1000]}       54.09           0.3005      1.7
[03/01/2023-11:45:20] [I]                fc1000 from nvm     3116.62          17.3145     97.8
[03/01/2023-11:45:20] [I]               data copy finish        0.49           0.0027      0.0
[03/01/2023-11:45:20] [I]             fc1000 copy finish        0.80           0.0044      0.0
[03/01/2023-11:45:20] [I]                          Total     3187.51          17.7084    100.0```
Thanks for your reply.
Do you have any idea why it takes so long (97.8% of the total latency) to move data from SRAM to CPU? It only takes 0.5% of the total latency to move data from the CPU to SRAM, and the input data size is larger than the output. It does not make sense.
Yes, it is precisely because the output data is much smaller than the input data that makes it unusual to copy the output data much slower than the input data.
In my model, input size is [1, 3, 224, 224], and the output size is [1000].
Hi, 1. After maximizing the device performance, the profile result is below:
[03/09/2023-15:49:11] [I] === Performance summary ===
[03/09/2023-15:49:11] [I] Throughput: 59.087 qps
[03/09/2023-15:49:11] [I] Latency: min = 16.8738 ms, max = 17.1115 ms, mean = 16.9044 ms, median = 16.8965 ms, percentile(99%) = 17.0645 ms
[03/09/2023-15:49:11] [I] Enqueue Time: min = 16.8612 ms, max = 17.0829 ms, mean = 16.8878 ms, median = 16.8809 ms, percentile(99%) = 17.0225 ms
[03/09/2023-15:49:11] [I] H2D Latency: min = 0.0222168 ms, max = 0.0327148 ms, mean = 0.0232986 ms, median = 0.0229492 ms, percentile(99%) = 0.0322266 ms
[03/09/2023-15:49:11] [I] GPU Compute Time: min = 16.8442 ms, max = 17.0732 ms, mean = 16.8726 ms, median = 16.8655 ms, percentile(99%) = 17.0198 ms
[03/09/2023-15:49:11] [I] D2H Latency: min = 0.00634766 ms, max = 0.024353 ms, mean = 0.00846027 ms, median = 0.00769043 ms, percentile(99%) = 0.0202637 ms
[03/09/2023-15:49:11] [I] Total Host Walltime: 3.02943 s
[03/09/2023-15:49:11] [I] Total GPU Compute Time: 3.0202 s
[03/09/2023-15:49:11] [W] * Throughput may be bound by Enqueue Time rather than GPU Compute and the GPU may be under-utilized.
[03/09/2023-15:49:11] [W]   If not already in use, --useCudaGraph (utilize CUDA graphs where possible) may increase the throughput.
[03/09/2023-15:49:11] [I] Explanations of the performance metrics are printed in the verbose logs.
[03/09/2023-15:49:11] [I]
[03/09/2023-15:49:11] [I]
[03/09/2023-15:49:11] [I] === Profile (191 iterations ) ===
[03/09/2023-15:49:11] [I]                          Layer   Time (ms)   Avg. Time (ms)   Time %
[03/09/2023-15:49:11] [I]                    data to nvm        7.59           0.0398      0.2
[03/09/2023-15:49:11] [I]  {ForeignNode[conv1...fc1000]}       17.36           0.0909      0.5
[03/09/2023-15:49:11] [I]                fc1000 from nvm     3191.52          16.7096     99.2
[03/09/2023-15:49:11] [I]               data copy finish        0.33           0.0017      0.0
[03/09/2023-15:49:11] [I]             fc1000 copy finish        0.55           0.0029      0.0
[03/09/2023-15:49:11] [I]                          Total     3217.37          16.8449    100.0
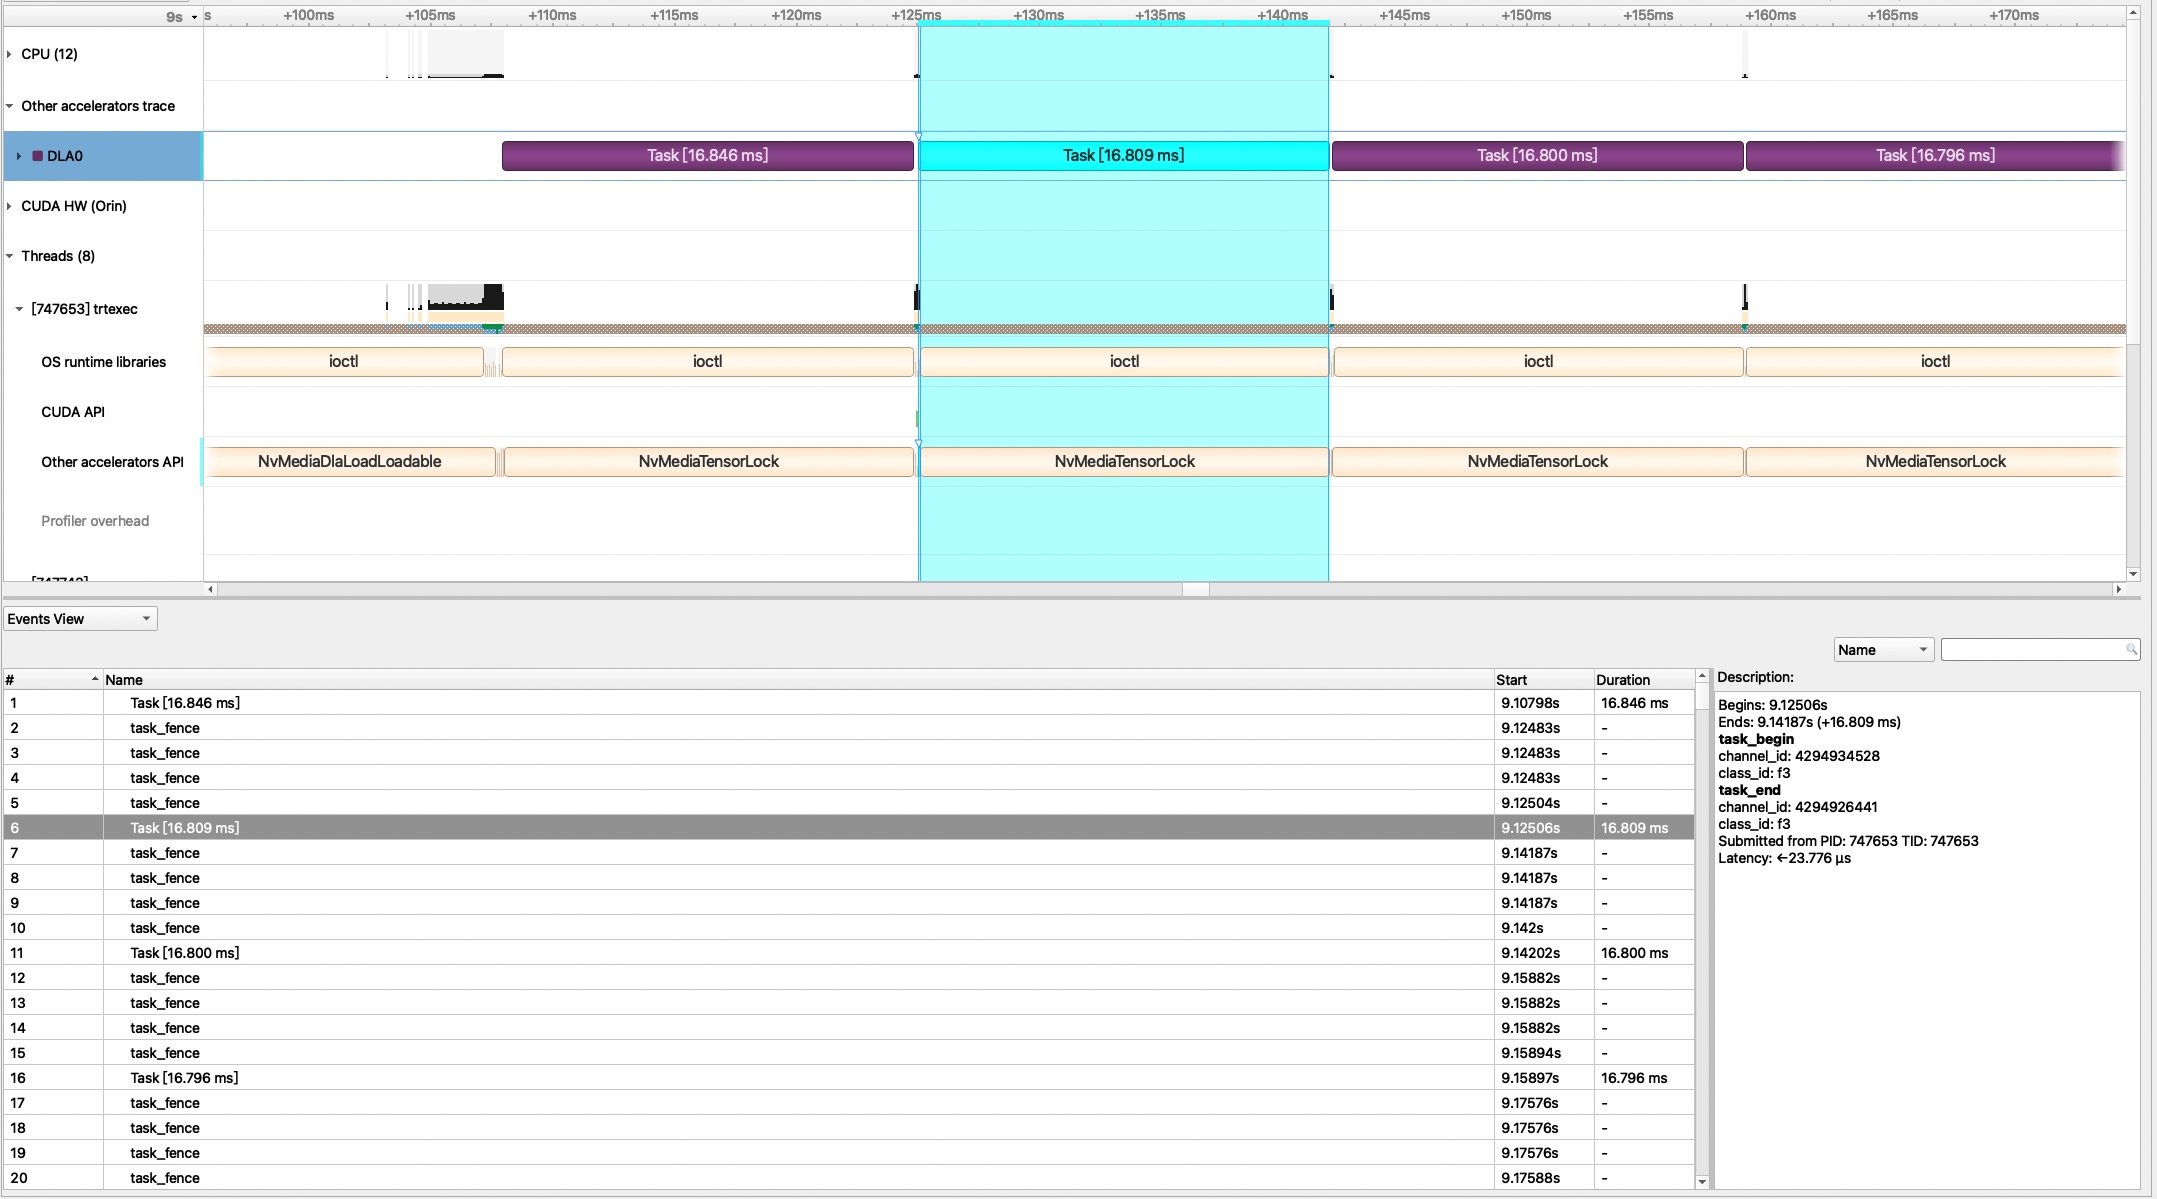
2. The latency of DLA task profiled with nsys resulted in approximately 16.8ms, similar to the trtexec profile result.
I also used the default ResNet50_N2.prototxt, but with the --fp16 option instead of --int8. If it’s not too much trouble, could you please try again with --fp16?
Hi,
The result with the command you mentioned is below.
[03/15/2023-14:34:04] [I] === Profile (180 iterations ) ===
[03/15/2023-14:34:04] [I]                          Layer   Time (ms)   Avg. Time (ms)   Time %
[03/15/2023-14:34:04] [I]                    data to nvm        7.88           0.0438      0.2
[03/15/2023-14:34:04] [I]  {ForeignNode[conv1...fc1000]}       16.84           0.0935      0.5
[03/15/2023-14:34:04] [I]                fc1000 from nvm     3194.42          17.7468     99.2
[03/15/2023-14:34:04] [I]               data copy finish        0.32           0.0018      0.0
[03/15/2023-14:34:04] [I]             fc1000 copy finish        0.53           0.0030      0.0
[03/15/2023-14:34:04] [I]                          Total     3219.99          17.8888    100.0
[03/15/2023-14:34:04] [I]
&&&& PASSED TensorRT.trtexec [TensorRT v8400] # /usr/src/tensorrt/bin/trtexec --deploy=/usr/src/tensorrt/data/resnet50/ResNet50_N2.prototxt --useDLACore=0 --fp16 --allowGPUFallback --dumpProfile --output=fc1000
I’ve noticed that we are currently using different versions of TensorRT. It appears that you are using version 8.5.02, while I am using version 8.4.0. I’ve also observed that there are differences in the dumped profiles between these two versions. Specifically, the dumped profile in version 8.4.0 includes the latency for ‘fc1000 from nvm’, while version 8.5.02 does not. I kindly request that you try running the test again using TensorRT version 8.4.0. Thank you for your patience and understanding.
Sorry, I can not upgrade JetPack now.
And from the profile result we post above, TensorRT 8.5 would not break down the inference process to data moving between SRAM and GPU. To reproduce my issue, it would be best to use version 8.4.0.