Hello, I have a piece of code written in Cutlass 3 which loads a matrix from global memory to shared memory. The thread layout is very naive, where each thread loads a 2 byte element with no stride.
#include <thrust/host_vector.h>
#include <thrust/device_vector.h>
#include <cute/layout.hpp>
#include <cute/tensor.hpp>

#include "cutlass/util/print_error.hpp"
#include "cutlass/util/GPU_Clock.hpp"
#include "cutlass/util/helper_cuda.hpp"


using Element = cutlass::half_t;

/// Vectorized copy kernel.
///
/// Uses `make_tiled_copy()` to perform a copy using vector instructions. This operation
/// has the precondition that pointers are aligned to the vector size.
///
template <typename TS, typename TD, class ThreadLayout, class VecLayout>
__global__ void copy_kernel_vectorized(__grid_constant__ const TS *const S, __grid_constant__ const TD *const D, ThreadLayout, VecLayout)
{
  using namespace cute;
  constexpr auto tensor_shape = Shape<_16, _32>{};
  __shared__ char smem_[size(tensor_shape) * sizeof(Element)];

  Tensor gS = make_tensor(
    make_gmem_ptr(const_cast<Element *>(reinterpret_cast<const Element *>(S))),
    make_layout(Shape<_16, _32>{}, GenRowMajor{}));
  Tensor gD = make_tensor(make_gmem_ptr(const_cast<Element *>(D)), make_layout(tensor_shape, GenRowMajor{}));

  Tensor sS = make_tensor(make_smem_ptr(const_cast<Element *>(reinterpret_cast<const Element *>(smem_))), make_layout(tensor_shape, GenRowMajor{}));

  // Define `AccessType` which controls the size of the actual memory access.
  using AccessType = cutlass::AlignedArray<Element, size(VecLayout{})>;

  // A copy atom corresponds to one hardware memory access.
  using Atom = Copy_Atom<DefaultCopy, Element>;

  auto tiled_copy =
    make_tiled_copy(
      Atom{},                       // access size
      ThreadLayout{},               // thread layout
      VecLayout{});                 // vector layout (e.g. 4x1)

  // Construct a Tensor corresponding to each thread's slice.
  auto thr_copy = tiled_copy.get_thread_slice(threadIdx.x);

  Tensor thr_tile_S = thr_copy.partition_S(gS);             // (CopyOp, CopyM, CopyN)
  Tensor thr_tile_D = thr_copy.partition_D(gD);             // (CopyOp, CopyM, CopyN)
  Tensor tSsSD = thr_copy.partition_D(sS); // (CopyOp, CopyM, CopyN)
  Tensor tSsSS = thr_copy.partition_S(sS); // (CopyOp, CopyM, CopyN)


  for (int i = 0; i < 65536 / 16; i++)
  {
    copy(tiled_copy, thr_tile_S, tSsSD);
    thr_tile_S.data() = thr_tile_S.data() + int(size(tensor_shape));
  }
}

/// Main function
int main(int argc, char** argv)
{

  using namespace cute;

  auto tensor_shape = cute::Shape<cute::_65536, cute::_32>{};

  thrust::host_vector<Element> h_S(size(tensor_shape));
  thrust::host_vector<Element> h_D(size(tensor_shape));

  for (size_t i = 0; i < h_S.size(); ++i) {
    h_S[i] = static_cast<Element>(static_cast<float>(i));
    h_D[i] = Element{};
  }

  thrust::device_vector<Element> d_S = h_S;
  thrust::device_vector<Element> d_D = h_D;

  //
  // Make tensors
  //

  Tensor tensor_S = make_tensor(make_gmem_ptr(thrust::raw_pointer_cast(d_S.data())), make_layout(tensor_shape, GenRowMajor{}));
  Tensor tensor_D = make_tensor(make_gmem_ptr(thrust::raw_pointer_cast(d_D.data())), make_layout(tensor_shape, GenRowMajor{}));

  // Thread arrangement
  Layout thr_layout = make_layout(make_shape(Int<8>{}, Int<32>{}), GenRowMajor{});

  // Vector dimensions
  Layout vec_layout = make_layout(make_shape(Int<1>{}, Int<1>{}), GenRowMajor{});

  //
  // Determine grid and block dimensions
  //

  dim3 gridDim (1024);   // Grid shape corresponds to modes m' and n'
  dim3 blockDim(size(thr_layout));

  //
  // Launch the kernel
  //
  copy_kernel_vectorized<<< gridDim, blockDim >>>(
    tensor_S.data().get(),
    tensor_D.data().get(),
    thr_layout,
    vec_layout);

  cudaError result = cudaDeviceSynchronize();
  if (result != cudaSuccess) {
    std::cerr << "CUDA Runtime error: " << cudaGetErrorString(result) << std::endl;
    return -1;
  }

  std::cout << "Success." << std::endl;

  return 0;
}
The above code compiles and runs with no bank conflict, as confirmed by nsight compute
cutlass/build$ make tiled_copy && ncu --section MemoryWorkloadAnalysis --metric l1tex__data_bank_conflicts_pipe_lsu_mem_shared_op_st.sum --launch-count 1 ./examples/cute/tutorial/tiled_copy
Building CUDA object examples/cute/tutorial/CMakeFiles/tiled_copy.dir/tiled_copy.cu.o
Linking CUDA executable tiled_copy
Built target tiled_copy
==PROF== Connected to process 3901463 (/home/sean/manifest2/packages/state_kernel/csrc/cutlass/build/examples/cute/tutorial/tiled_copy)
==PROF== Profiling "copy_kernel_vectorized" - 0 (1/1): 0%....50%....100% - 7 passes
Success.
==PROF== Disconnected from process 3901463
[3901463] tiled_copy@127.0.0.1
  void copy_kernel_vectorized<half_t, half_t, Layout<tuple<C<8>, C<32>>, tuple<C<32>, C<1>>>, Layout<tuple<C<1>, C<1>>, tuple<C<0>, C<0>>>>(const T1 *, const T2 *, T3, T4) (1024, 1, 1)x(256, 1, 1), Context 1, Stream 7, Device 0, CC 8.6
    Section: Command line profiler metrics
    -------------------------------------------------------- ----------- ------------
    Metric Name                                              Metric Unit Metric Value
    -------------------------------------------------------- ----------- ------------
    l1tex__data_bank_conflicts_pipe_lsu_mem_shared_op_st.sum                        0
    -------------------------------------------------------- ----------- ------------

    Section: Memory Workload Analysis
    --------------------------- ----------- ------------
    Metric Name                 Metric Unit Metric Value
    --------------------------- ----------- ------------
    Memory Throughput               Mbyte/s       885.50
    Mem Busy                              %         9.11
    Max Bandwidth                         %        17.90
    L1/TEX Hit Rate                       %        91.80
    L2 Compression Success Rate           %            0
    L2 Compression Ratio                               0
    L2 Hit Rate                           %        99.85
    Mem Pipes Busy                        %        17.90
    --------------------------- ----------- ------------
However, if I add more share memory than necessary by changing this line
cutlass/build$ make tiled_copy && ncu --section MemoryWorkloadAnalysis --metric l1tex__data_bank_conflicts_pipe_lsu_mem_shared_op_st.sum --launch-count 1 ./examples/cute/tutorial/tiled_copy
Building CUDA object examples/cute/tutorial/CMakeFiles/tiled_copy.dir/tiled_copy.cu.o
Linking CUDA executable tiled_copy
Built target tiled_copy
==PROF== Connected to process 3902130 (/home/sean/manifest2/packages/state_kernel/csrc/cutlass/build/examples/cute/tutorial/tiled_copy)
==PROF== Profiling "copy_kernel_vectorized" - 0 (1/1): 0%....50%....100% - 7 passes
Success.
==PROF== Disconnected from process 3902130
[3902130] tiled_copy@127.0.0.1
  void copy_kernel_vectorized<half_t, half_t, Layout<tuple<C<8>, C<32>>, tuple<C<32>, C<1>>>, Layout<tuple<C<1>, C<1>>, tuple<C<0>, C<0>>>>(const T1 *, const T2 *, T3, T4) (1024, 1, 1)x(256, 1, 1), Context 1, Stream 7, Device 0, CC 8.6
    Section: Command line profiler metrics
    -------------------------------------------------------- ----------- ------------
    Metric Name                                              Metric Unit Metric Value
    -------------------------------------------------------- ----------- ------------
    l1tex__data_bank_conflicts_pipe_lsu_mem_shared_op_st.sum                       22
    -------------------------------------------------------- ----------- ------------

    Section: Memory Workload Analysis
    --------------------------- ----------- ------------
    Metric Name                 Metric Unit Metric Value
    --------------------------- ----------- ------------
    Memory Throughput               Mbyte/s       888.89
    Mem Busy                              %         8.87
    Max Bandwidth                         %        17.41
    L1/TEX Hit Rate                       %        91.80
    L2 Compression Success Rate           %            0
    L2 Compression Ratio                               0
    L2 Hit Rate                           %        97.11
    Mem Pipes Busy                        %        17.41
    --------------------------- ----------- ------------
which shows 22 bank conflict. I suspect this is the compiler doing some optimization (since it sees the large space to be used?) which breaks the synchronization of threads doing copy.
Then I added a __syncwarp after the copy, meaning instead of
  for (int i = 0; i < 65536 / 16; i++)
  {
    copy(tiled_copy, thr_tile_S, tSsSD);
    thr_tile_S.data() = thr_tile_S.data() + int(size(tensor_shape));
  }
I do
  for (int i = 0; i < 65536 / 16; i++)
  {
    copy(tiled_copy, thr_tile_S, tSsSD);
    __syncwarp();
    thr_tile_S.data() = thr_tile_S.data() + int(size(tensor_shape));
  }
Running it again gives 5,713,107 bank conflict.
cutlass/build$ make tiled_copy && ncu --section MemoryWorkloadAnalysis --metric l1tex__data_bank_conflicts_pipe_lsu_mem_shared_op_st.sum --launch-count 1 ./examples/cute/tutorial/tiled_copy
Building CUDA object examples/cute/tutorial/CMakeFiles/tiled_copy.dir/tiled_copy.cu.o
Linking CUDA executable tiled_copy
Built target tiled_copy
==PROF== Connected to process 3902926 (/home/sean/manifest2/packages/state_kernel/csrc/cutlass/build/examples/cute/tutorial/tiled_copy)
==PROF== Profiling "copy_kernel_vectorized" - 0 (1/1): 0%....50%....100% - 7 passes
Success.
==PROF== Disconnected from process 3902926
[3902926] tiled_copy@127.0.0.1
  void copy_kernel_vectorized<half_t, half_t, Layout<tuple<C<8>, C<32>>, tuple<C<32>, C<1>>>, Layout<tuple<C<1>, C<1>>, tuple<C<0>, C<0>>>>(const T1 *, const T2 *, T3, T4) (1024, 1, 1)x(256, 1, 1), Context 1, Stream 7, Device 0, CC 8.6
    Section: Command line profiler metrics
    -------------------------------------------------------- ----------- ------------
    Metric Name                                              Metric Unit Metric Value
    -------------------------------------------------------- ----------- ------------
    l1tex__data_bank_conflicts_pipe_lsu_mem_shared_op_st.sum                5,713,107
    -------------------------------------------------------- ----------- ------------

    Section: Memory Workload Analysis
    --------------------------- ----------- ------------
    Metric Name                 Metric Unit Metric Value
    --------------------------- ----------- ------------
    Memory Throughput               Gbyte/s         1.85
    Mem Busy                              %        85.43
    Max Bandwidth                         %        92.53
    L1/TEX Hit Rate                       %         0.09
    L2 Compression Success Rate           %            0
    L2 Compression Ratio                               0
    L2 Hit Rate                           %        99.90
    Mem Pipes Busy                        %        92.53
    --------------------------- ----------- ------------
Could this be the compiler is reordering the copy in a way that I don’t quite understand?
You can study what the compiler is doing by studying the SASS code. The cuobjdump tool can be used for that, or even godbolt
I’m of the strong opinion that bank-conflicted access (or not) can be deduced from the source code. The idea that the compiler could/would do something contrary to that is doubtful to me, although I have been wrong before.
I do not think it is strictly possible with 100% accuracy in all cases to determine the presence or absence of shared memory bank conflicts by studying a single metric. At least partly based on this, and partly based on the observations I have made myself from time to time in the past that clearly un-bank-conflicted code shows up as bank conflicts in one metric or another.
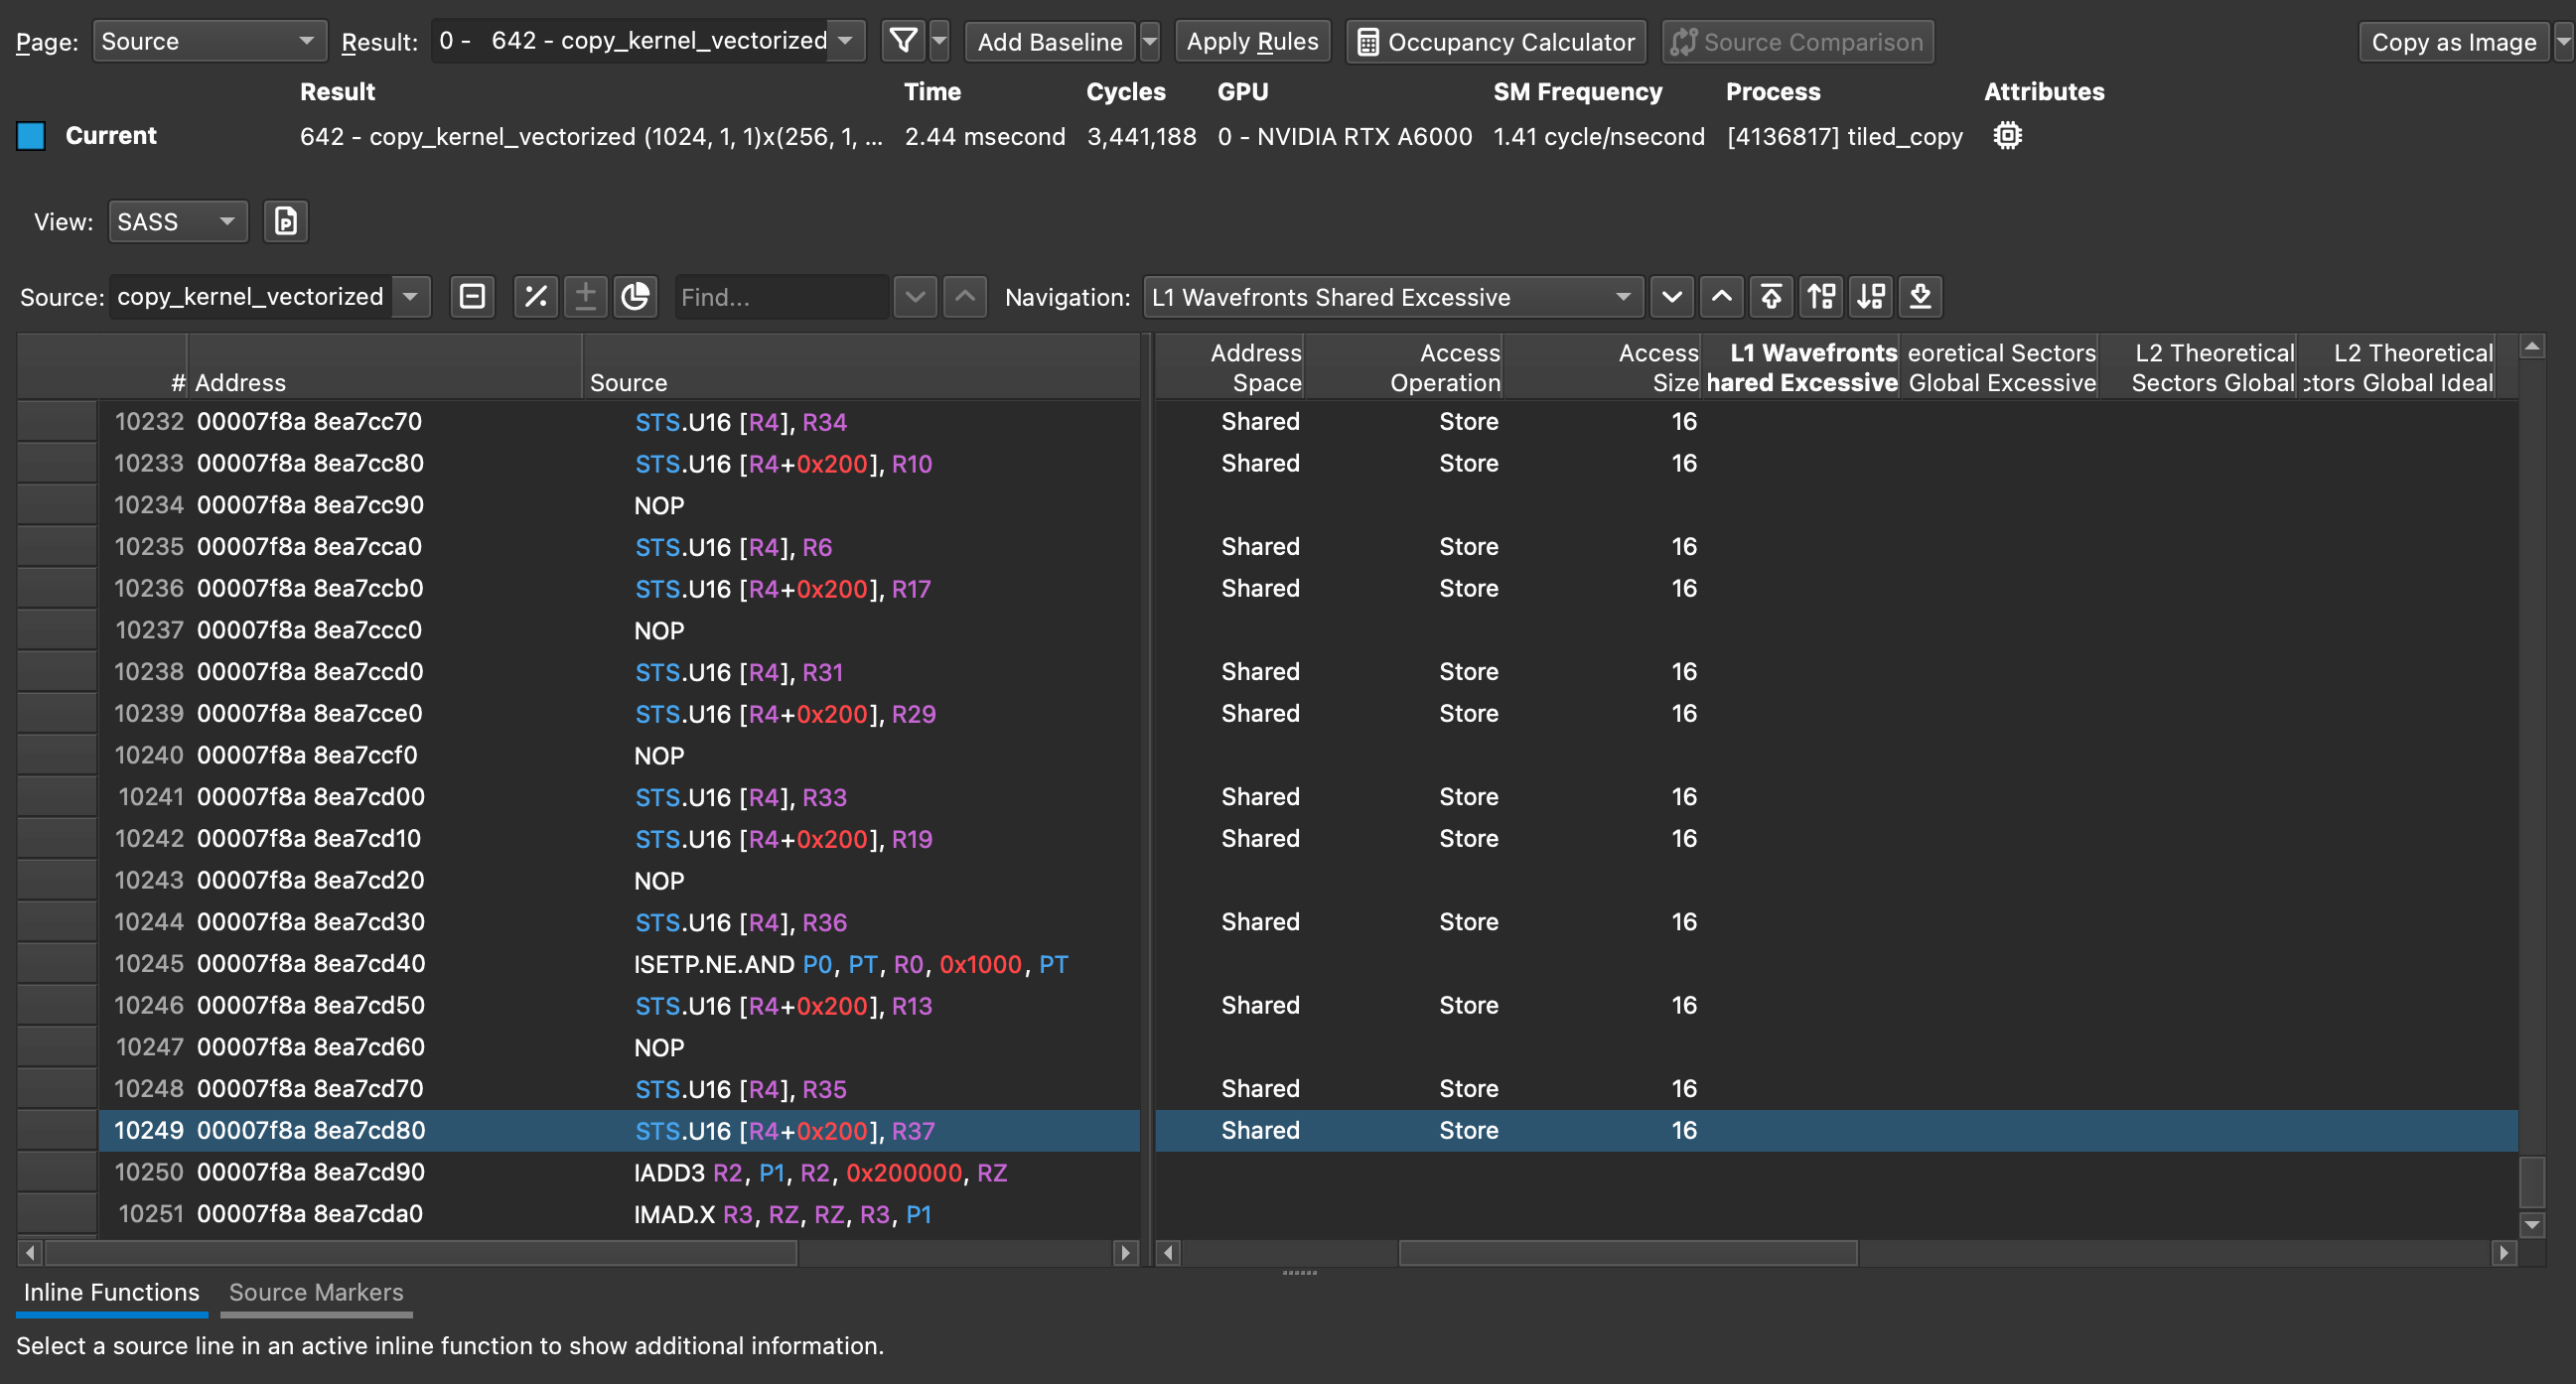
@Robert_Crovella Thanks! I checked L1 wavefront excessive and there seems to be no excessive wavefronts, but does this mean there’s no bank conflict at all?If so, why does this contradict to the l1tex__data_bank_conflicts_pipe_lsu_mem_shared_op_st.sum metric? Is the description “# of shared memory data bank conflicts generated by STs, ST, 3D attribute stores, LDGSTS” of the metric not accurate?
I don’t really know if your code has bank conflicts or not. I haven’t studied the code. That is the only method I have ever used to be confident about answering such a question. I’m convinced the method is both possible and reliable in every case except a data-dependent load pattern, in which case I view the question as moot.
You don’t seem to want to follow either of the suggestions I gave you. I don’t have any other suggestions. I won’t be able to help with the metric interpretation. Sorry. Another possible resource for profiler questions is one of the profiler forums.
I also compared the sass code of my code with excessive share memory allocation, and the sass code without excessive share memory allocation ( bank conflict debug - Diffchecker, but there doesn’t seems to have any difference.
Although I’ve noticed that there’re ...... at the end of sass output, so perhaps cuobjdump doesn’t print everything? Is there a way I could make cuobjdump dump all sass code? I’m printing the sass code this way
The ..... don’t mean that it is not dumping all the code. Typically at the end of a routine (__device__ or __global__) there will be an EXIT opcode, sometimes after that a branch-to-self, and then sometimes a few more NOP. All of your routines end that way, from what I can see. You’re seeing all the code. I’ve never heard of nor witnessed a case where cuobjdump did not show all the code associated with any entry points you define.
I certainly would not expect a larger-than-necessary shared memory allocation to have any important effect on compiler code generation. Imagining the compiler is doing something different doesn’t seem very plausible to me.
I feel like you have something like 3 or 4 separate data points now that all suggest that there is no bank conflict. There is one “contrary” datapoint, the metric.
Thanks Robert! That makes the most sense to me as well (i.e., no bank conflict). How should one interpret the “l1tex__data_bank_conflicts_pipe_lsu_mem_shared_op_st.sum” metric in this case? Should I simply ignore it?