I just updated to Cuda 12.1 and now can’t seem to get debugging to work in OptiX 7.6
I’ve updated to the latest Nsight that claims compatibility with Cuda 12.1 and latest drivers for my RTX 3090. It doesn’t work in my own projects and I tested on the optixHello sample in the OptiX 7.6 SDK and it does not work for me when I set a breakpoint and run Extensions->Nsight->Start Cuda Debugging from Visual Studio 2022.
Also printf() is not working either.
I tried debugging the CudaSamples and everything works as expected there.
I also tried on my laptop(RTX 3060) which is still using Cuda 12.0 and it works as expected too.
OptiX 7.6
Geforce RTX 3090 driver 531.18
Nsight Visual Studio Edition version 2023.1 build # 2023.10.23044
Windows 11 Pro
Can you try debugging after setting the environment variable OPTIX_FORCE_DEPRECATED_LAUNCHER to 1? I didn’t realize we were missing this info in the OptiX Programming Guide & Release Notes, we’ll get it fixed. For now there is a mention in the CUDA Programming Guide.
12.12. Debugging OptiX/RTCore applications
When debugging programs built with OptiX/RTCore, it may be necessary to set the environment variable OPTIX_FORCE_DEPRECATED_LAUNCHER to 1. If breakpoints are unable to be hit, try setting this environment variable before starting your application.
Sorry for the debugging bumps, this is a temporary workaround due to some underlying infrastructure changes we’re making.
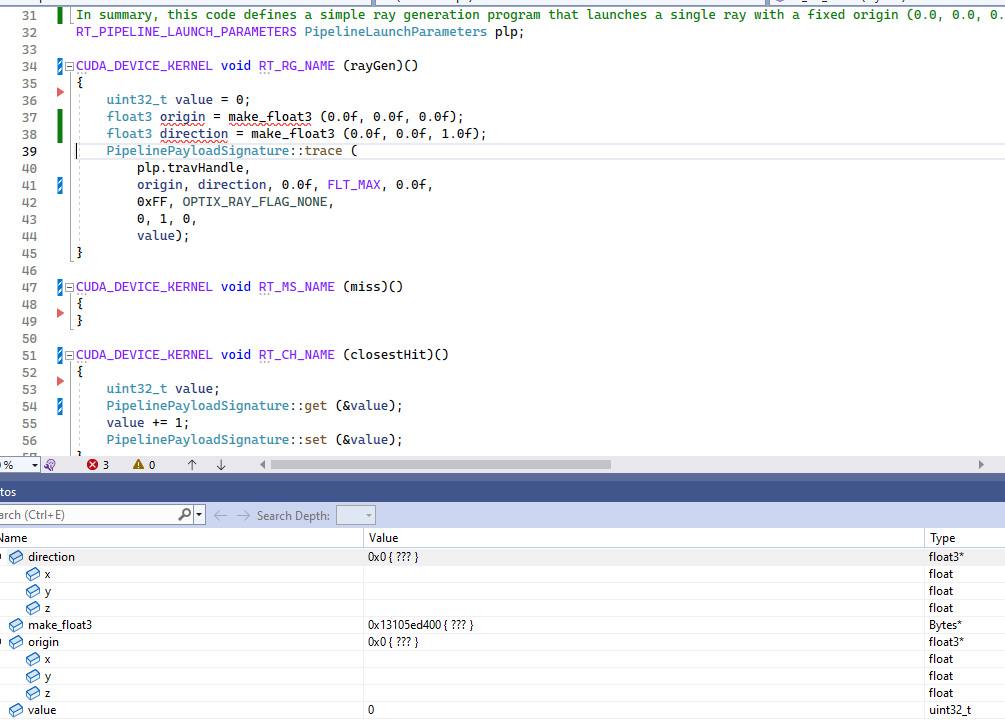
With OPTIX_FORCE_DEPRECATED_LAUNCHER set, I am hitting break points now and printf() is working again too., But just so you know, I’m not getting any component values displayed for vectors like float3. I’m pretty sure that worked before the 12.1 update.
Yeah the support for showing locals and structs in the debugger hasn’t yet always worked reliably, especially inside a function containing an optixTrace() call, though I think it’s improving little by little. I believe it usually does work in functions without a trace call. So this might not be super helpful or convenient, but one thing you can try is temporarily commenting the trace call, that usually seems to increase the number of things visible in the debugger.
Does OPTIX_FORCE_DEPRECATED_LAUNCHER affect more than debugging feature?
My program that crashed only in Debug build without this env variable runs without crash when I set the variable.
Yes, it’s not about debugging features. It changes some internals about the launch mechanism, alas the environment variable name.
Do you have more information about the kind of crash you observed in a debug build target?
Error output?
The OptixModuleCompileOptions, OptixPipelineCompileOptions, OptixPipelineLinkOptions field values?
The system configuration information:
OS version, installed GPU(s), VRAM amount, display driver version, OptiX (major.minor.micro) version, CUDA toolkit version (major.minor) used to generate the input PTX, host compiler version.
Of course the best would be a minimal reproducer project in failing state.
Thanks for the projects.
I could reproduce the CUDA error “unspecified launch failure” on the first optixLaunch using the first project on an Ada board running Windows 10 and 531.18 drivers and filed a bugreport for investigation.
It’s also not happening when not using the full debug settings inside the module and pipeline compile and link options, means when changing your DEBUG_SELECT macro.
Some comments on the debugging experience:
I’m not sure how your check macros are supposed to work but I did not get the necessary error messages printed from the exception catch before some part of the code called assert and aborted the program.
I needed to manually add some cuSynchronizeStream() calls around the optixLaunch to query the error code myself.
I use that MY_ASSERT() macro inside all OptiX and CUDA CHECK macros before throwing the exception which let’s the debugger break on the error location itself so that you can look at the message inside the debugger and not once the exception is caught.
The analysis of this is still ongoing and so far the issue seems to be related to the stack size.
As a workaround until a complete fix, adding an explicit stack size calculation after the pipeline creation will prevent the crash of the reproducer:
If the explicit stack size calculation code solved the issues inside your application, that is actually the final solution.
The OptiX documentation about the default stack size calculation is incorrectly stating that direct callables are taken into account for limited calling depths which is not actually happening and will be fixed inside the documentation. The stack size always needs to be calculated explicitly when using callables.