I’ve ran into some issues with my project when running DLA and GPU at the same time, so I went back to your sample.
As far as I understand, I see the same behavior in your test code.
I ran the test under nvprof in the following manner: ./test -1 → Result is shown in gpu_only.jpg
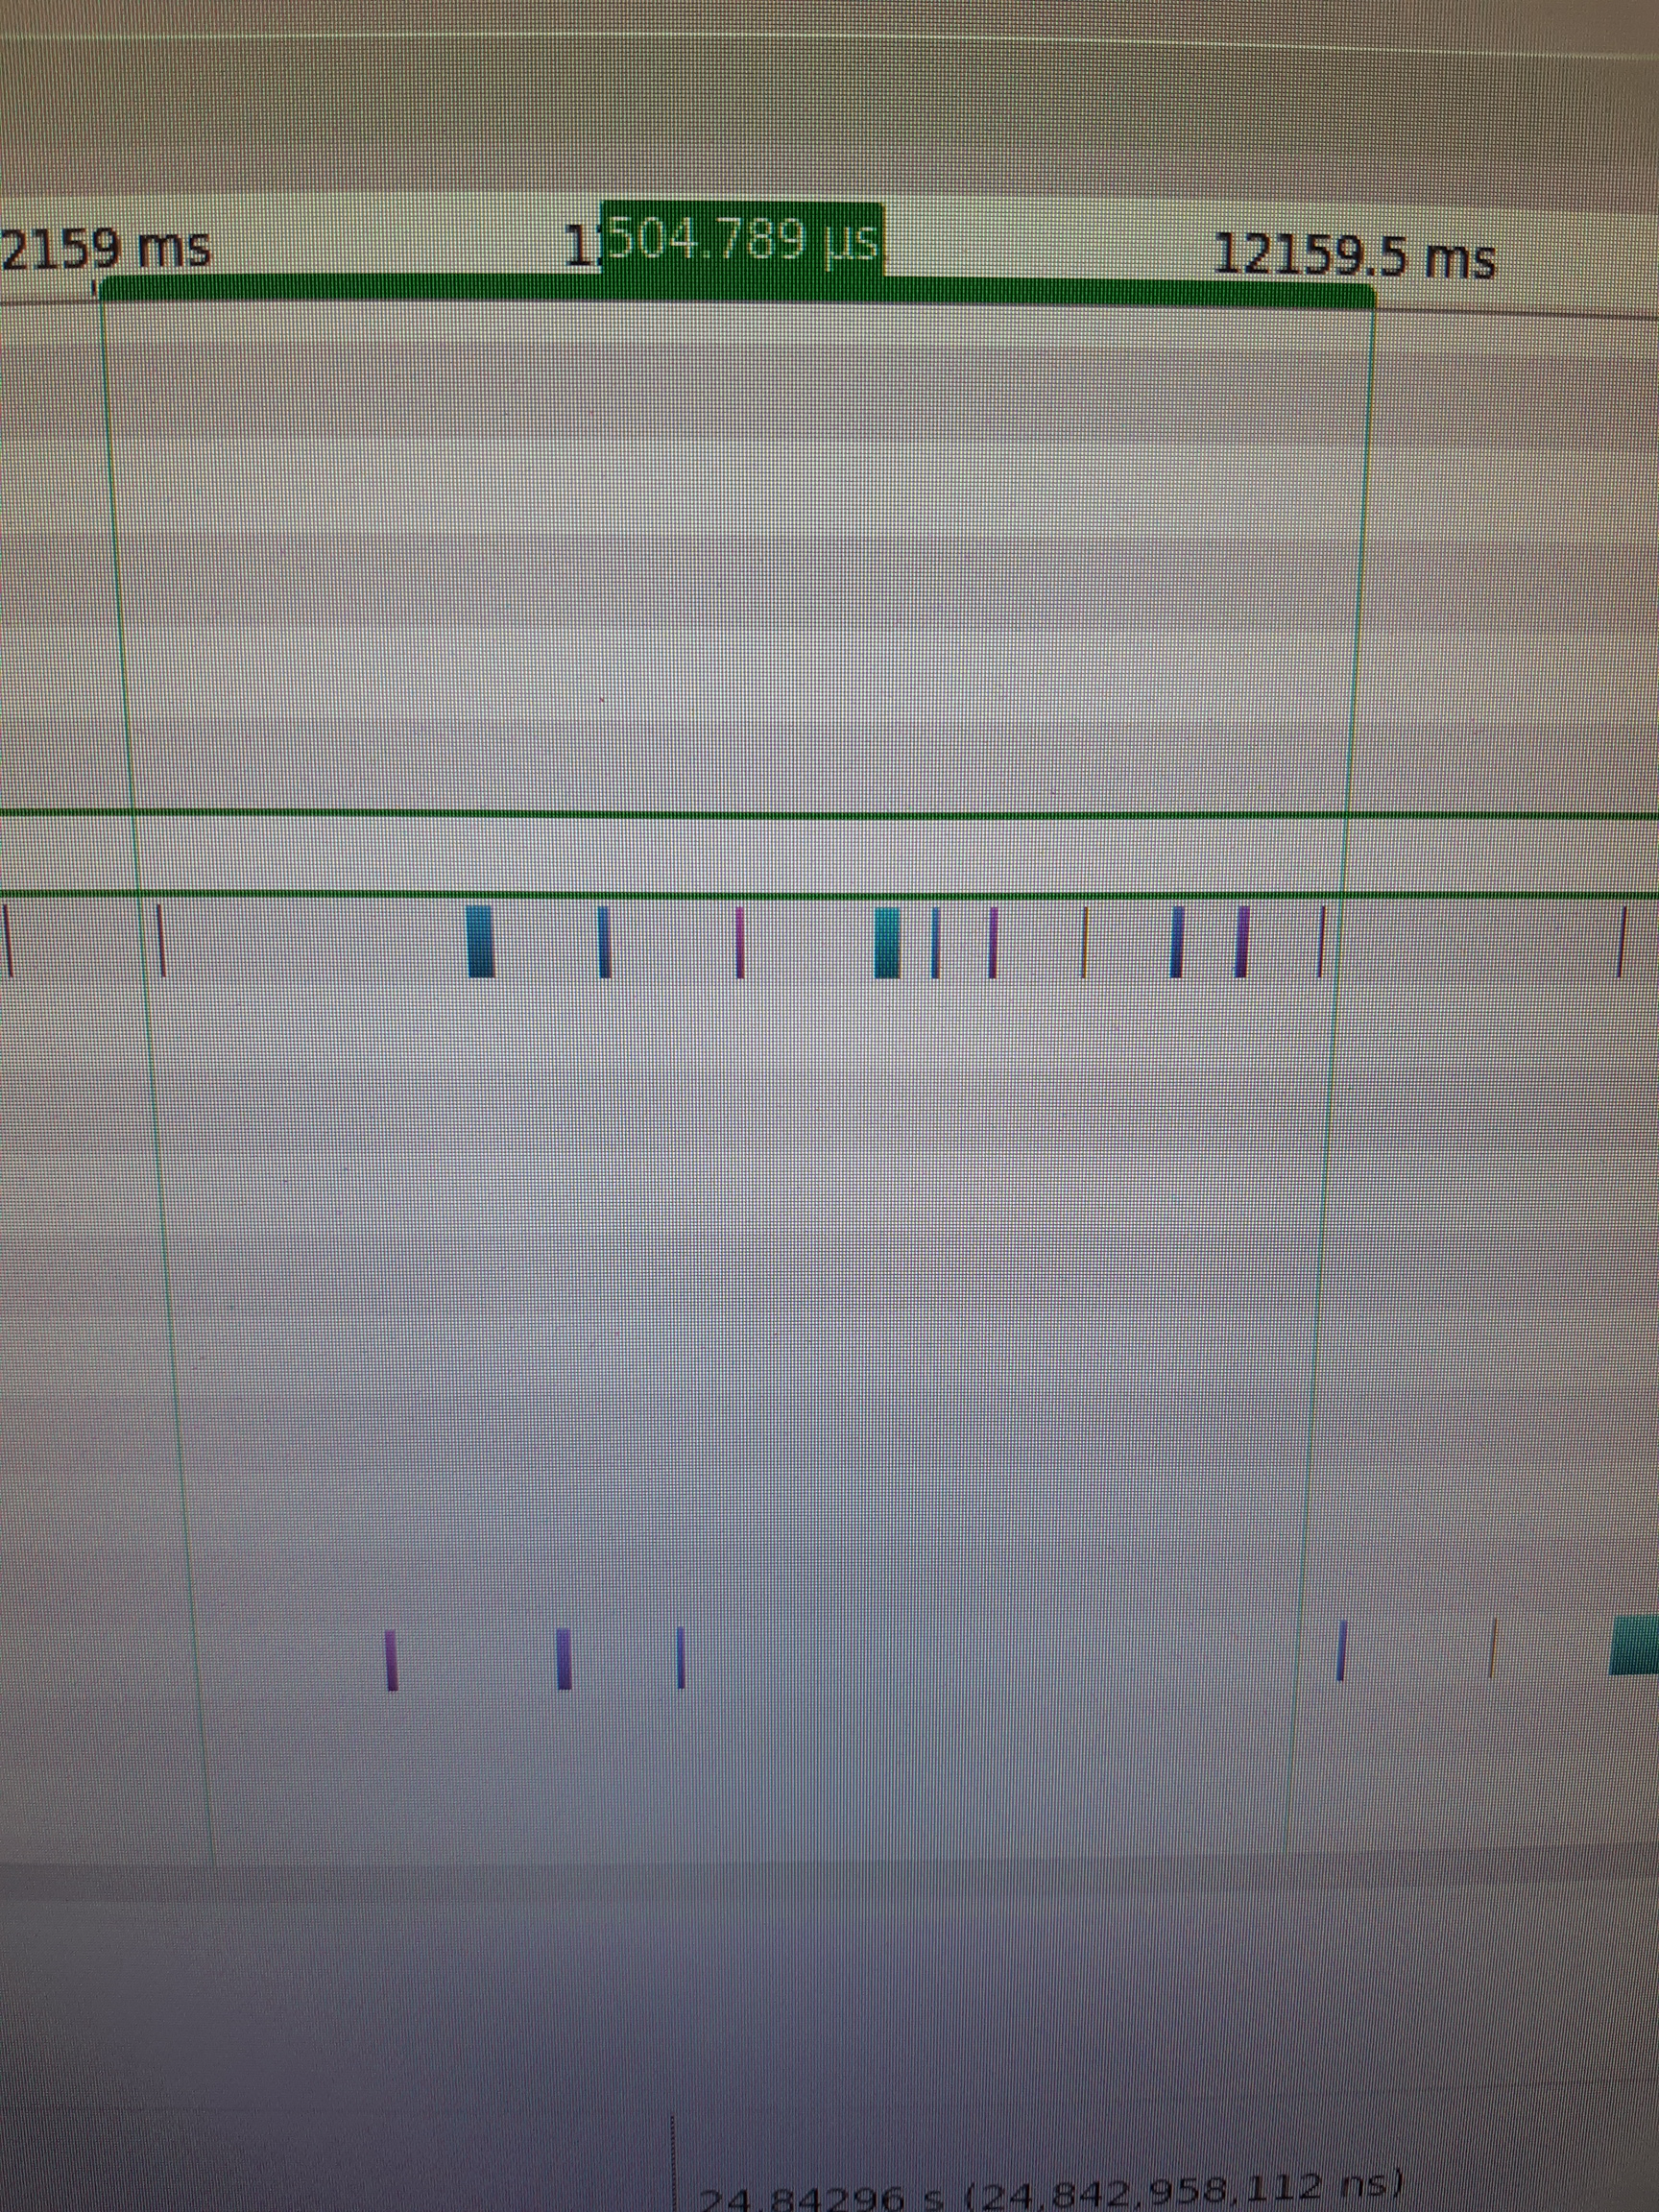
Ran ./test -1 0 → Result is shown in gpu_dla.jpg
I’ve instrumented the code with an empty cuda kernel and called it before and after the enqueue call.
That way I know when the GPU/DLA functionality starts and ends.
As can be seen in the attached images, when I run the GPU alone, it takes ~230-250ms. When the GPU and DLA run together it takes about ~500ms .
The gpu_dla.jpg shows that the dla and gpu run concurrently (at least to some degree) but it seems they block/interfere with each other. This is what I also see in my test code.
I understand that this might be due to lack of resources/network configuration/network layers etc… however the end result is that moving even a simple test to the DLA did not improve performance over running everything alone on the GPU.
The cause of this issue is from some false dependencies on pthread mutex, which force TensorRT to wait (either GPU or DLA).
It can be reproduced with DLA+GPU or GPU+GPU. Based on this, it seems some issues on the application.
Not sure if you have tried the trtexec binary located at /usr/src/tensorrt/bin?
It also supports multiple streams inference but doesn’t have this performance regression.
It’s worthy to try if updating the trtexec for multiple engines can fix your issue or not.
Hi @AastaLLL
Thanks a lot for the answer. The application is actually something you yourself sent in the past - and the issue occurs in my code as well.
So just to make sure I understand - this is something to do with an internal pthread issue? linux issue?
I don’t quite understand what is the suggested solution, can you please elaborate?
I’ll have a look in the trtexec code - I should have its C++ code right?
We do know the application is sent from us. Just trying to share some status with you.
Sorry if this make you feel confused.
In trtexec, the API for threading (CPU->GPU) is a little bit different (lower-level).
For time concern, it can be an alternative solution to try.
For the app we shared, the issue is from some unknown latency when CPU launch GPU tasks.
The launch is applied frequently since each operation within a model is a separate GPU task. (if not merged)
We observe the launching will have some unknown latency (waif for mutex), which may related to priority.
But we still need more time to figure out the detail.
Hi @AastaLLL,
Thanks a lot for the information. Is the trtexec code open so I can have a look at how threading is done there? Where is it?
thanks a lot for all the effort to assist. If you have further information as to how to use the default threading mechanism, I would appreciate if you could share this information as well.
Hi @AastaLLL,
Sorry for being a nudge and bring this up again… I don’t see any threading reference in the trtexec code.
The execute method runs on a CUDA stream but I don’t see any threads going on there.
Could you please point me to what you’ve suggested there?