Hi,
I am new to NVIDIA Jetson Xavier, and I wanna do a performance test and see if it fits my project. I tried both running cuda-10.0 samples with nvprof and nv-nsight-cu-cli but neither of them returned anything related to dram_utilization. I have checked their “–query-metrics” and found nothing. Please tell me how to check anything related to dram if anyone knows.
Thanks for your quick response! I have tried use both tools. Unfortunately, tegrastats only gives me the overall status rather than specific app that I launched. On the other hand, Nsight Systems gives me a lot of info but I did not find anything related to device memory. I have also checked nvprof, nvvp as well as Nsight Compute, the device memory section is left n/a. It does not make sense cause the model I load from device memory is over 50MB and system_read_bytes in nvprof only shows 1.2MB. Did I miss anything?
PS: Hope you could also explain how this system_read_bytes come from.
Do you use TensorRT or cuDNN related API?
A common cause is that it takes some memories to load the libraries, which won’t be shown on the profiling tool.
Here is a related topic for checking the memory usage from the libraries:
Thanks for the update and I will take a look at the related topic right away!
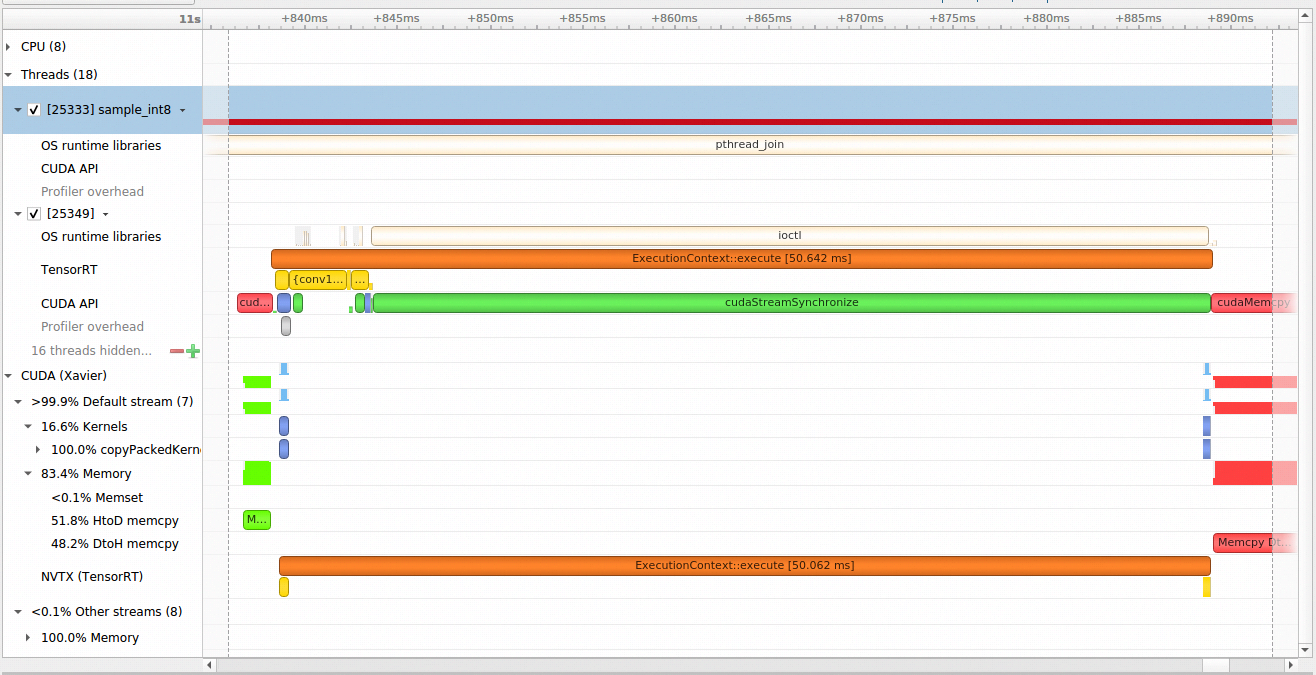
Yes, I used TensorRT APIs for inferencing data. I parsed a model and created tensorRT engine. After that I created an execute context. I did another test using command line version of Nsight System and import the report to my desktop which gave me more information than GUI version, and here is what I’ve got.
Thanks for the quick response!
Sure, I have prepared a simple test using ResNet-50 model and trtexec under tensorrt sample folder. The difference between my code and this simple test is that I synchronously execute the inference, and my code has cudaStreamSynchronize and this one has cudaEventSynchronize. But, they both have similar issue, cudaEventSynchronize also takes a lot of time, and through profiling tools (Nsight System, nvprof), I could not see any data transfering during that time period.
Here is the command line I used to execute:
./trtexec --avgRuns=100 --deploy=resnet50.prototxt --int8 --batch=8 --iterations=1000 --output=fc1000 --useDLACore=0 --useSpinWait --allowGPUFallback
I have upload the the model file that I used is in this link: https://drive.google.com/open?id=1ohTe5C2JZIR7tJbqwf5uSxJm2flm1Ecp
Seems like there is something wrong with my google drive. I uploaded it to my github and you can download it from the link below. Please let me know if you need more info.
We found it is possible that cudaStreamSynchronize takes long times as you reported.
For example,
If CPU calls cudaStreamSynchronize right after launching a TensorRT job with enqueue(…), it must to wait for the output from TensorRT.
So when a model takes longer on TensorRT, the cudaStreamSynchronize time also becomes larger.
We test your sample with trtexec and the average execution time with batchsize=8 is 20 ms.
You can also try it with trtexec to see the end-to-end latency first.
Thanks for your reply! I have tested trtexec with batchsize=1 and I agree with what you said, the average execution time is lower. Now, I just want to ask one more question, is it possible to see any Cuda Kernels executed during TensorRT, for example, using nvprof?
Seems like nvprof can detect more Cuda Kernels when the program is running on GPU. For DLA case, there is just a gap and I don’t see any related Kernels. Could you explain how to see those Cuda Kernels for DLA case?
The test command line for DLA is :
./trtexec --avgRuns=1 --deploy=resnet50.prototxt --int8 --batch=1 --iterations=1 --output=fc1000 --useDLACore=1 --useSpinWait --allowGPUFallback
and without DLA is:
./trtexec --avgRuns=1 --deploy=resnet50.prototxt --int8 --batch=1 --iterations=1 --output=fc1000 --useSpinWait --allowGPUFallback
In the DLA pipeline, you can still capture some kernel usage since DLA use GPU for some data conversion.
However, the inference job performed via DLA won’t show on the timeline.