I want to see the comparision of utilization of cuda core and tensor core, so which tool should I use, nsight-system or nsight compute? GPU: NVIDIA Tesla V100S-PCIE-32GB
For nsight-system, I have looked for nsight-system documentation, it seems that I can get the SM utilization (include tensor core utilization) through this command:
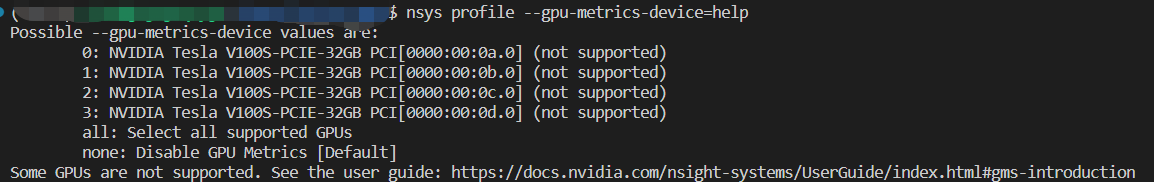
nsys profile --gpu-metrics-device
but there are some limits ( in official documentation) :
Nsight Systems GPU Metrics is only available for Linux targets on x86-64 and aarch64, and for Windows targets. It requires NVIDIA Turing architecture or newer.

Minimum required driver versions:

* NVIDIA Turing architecture TU10x, TU11x - r440
* NVIDIA Ampere architecture GA100 - r450
* NVIDIA Ampere architecture GA100 MIG - r470 TRD1
* NVIDIA Ampere architecture GA10x - r455
does it mean that I can’t use the --gpu-metrics-device to observe the tensor core utilization since my gpu is vlota achitecture? the follow is my command and result:
For nsight-compute, I can get the pipeline utilization, but it doesn’t change as time goes by. so I want to get the comparision of the utilization of cuda core and tensor core, like this :
I’m a fresher in this field, I really need help. what should I do? Any response would be greatly appreciated!
Nsight Compute can give you many pipeline utilization metrics, including the ones you listed, but only on a per-kernel (or per-range, depending on the replay mode) level. It does not provide such information with time-correlated granularity.
Really thanks for your help! that’s right, when i use nsight-compute, I can get pipeline utilization metrics, but the utilization of two cores over time cannot be obtained.
On Turing+ the General Metrics for XYZ set does not have the FP32 Utilization which would be CUDA Core Utilization. The Graphics Throuhgput Metrics for XYZ should have the FP32 Utilization which is logically equivalent to CUDA Cores.
The NVIDIA Streaming Multi-processors (SMs) have many different instruction execution pipes (fmalite, fmaheavy, alu, fma64, xu/sfu, lsu, tex, …). CUDA cores refers to the number of FP32 execution units (number of operations fma, fmalite, and fmaheavy) can perform per cycle. FP32 FLOPS and FP32 execution units is one of the common mechanisms to compare graphics focused GPUs. HPC comparisons use FP64 FLOPS and interference/training use mixed precision TOPS.