Hi
Is it possible to see a “call stack” like information about the kernels that are running in an application? I see some kernel names in the profiler that are part of CUDNN libraries (or whatever the library name is), but I am not able to find which upper C++ function calls this kernel. As the names are complex, I guess there are wrappers that form the final kernel name. I see these complex names when analyzing mlperf workloads. Is that possible with Nsight Systems or other tools?
There is an option to collect the back traces you want, but it causes a fair amount of overhead.
See --cudabacktrace in User Guide :: Nsight Systems Documentation for details (the link is directly to the section).
Collect backtraces for API calls longer than X seconds** - turns on collection of CUDA API backtraces and sets the minimum time a CUDA API event must take before its backtraces are collected. Setting this value too low can cause high application overhead and seriously increase the size of your results file.
I used the command nsys profile --cudabacktrace all python3 code.py and then nsys stats report1.nsys-rep, but I don’t see the information I want.
This is part of the output:
Using report1.sqlite for SQL queries.
Running [/home/mnaderan/nsight-systems-2022.2.1/target-linux-x64/reports/nvtxsum.py report1.sqlite]... SKIPPED: report1.sqlite does not contain NV Tools Extension (NVTX) data.

Running [/home/mnaderan/nsight-systems-2022.2.1/target-linux-x64/reports/osrtsum.py report1.sqlite]...

 Time (%)   Total Time (ns)    Num Calls      Avg (ns)          Med (ns)      Min (ns)      Max (ns)         StdDev (ns)              Name
 --------  ------------------  ---------  ----------------  ----------------  --------  -----------------  ----------------  ----------------------
     51.3  31,928,555,883,735    101,770     313,732,493.7     100,108,949.0     1,000  8,338,581,591,946  36,767,938,230.9  poll
     16.3  10,122,109,480,535      4,365   2,318,925,425.1   1,994,086,499.0    12,470      7,308,696,074   1,049,176,820.8  pthread_cond_wait
     16.2  10,066,843,008,064     20,989     479,624,708.6     500,059,804.0     1,290        501,853,337      98,863,598.2  pthread_cond_timedwait
     16.2  10,066,707,621,826        710  14,178,461,439.2  14,340,671,293.5     9,790     20,867,013,689   1,679,887,717.0  sem_wait
      0.0         690,089,013      2,120         325,513.7          19,310.0     1,020          1,227,352         450,191.9  munmap
...
Running [/home/mnaderan/nsight-systems-2022.2.1/target-linux-x64/reports/cudaapisum.py report1.sqlite]...

 Time (%)  Total Time (ns)  Num Calls    Avg (ns)    Med (ns)   Min (ns)   Max (ns)     StdDev (ns)               Name
 --------  ---------------  ---------  ------------  ---------  --------  -----------  -------------  ----------------------------
     31.4    5,312,041,255    414,585      12,812.9    8,781.0     3,560  815,782,786    1,269,128.8  cudaLaunchKernel
     30.9    5,226,133,521    414,585      12,605.7    8,590.0     3,460  815,782,245    1,269,128.2  cudaLaunchKernel
      5.7      958,886,672         28  34,245,952.6  116,112.0     3,400  955,484,402  180,545,804.1  cudaMalloc
      5.7      958,881,281         28  34,245,760.0  115,972.0     3,300  955,483,772  180,545,718.3  cudaMalloc
      4.3      730,008,977      6,378     114,457.3   24,640.0     3,410    1,429,386      247,324.7  cudaMemcpyAsync
      4.3      728,763,880      6,378     114,262.1   24,481.0     3,310    1,428,746      247,308.8  cudaMemcpyAsync
...
Running [/home/mnaderan/nsight-systems-2022.2.1/target-linux-x64/reports/gpukernsum.py report1.sqlite]...

 Time (%)  Total Time (ns)  Instances  Avg (ns)   Med (ns)   Min (ns)  Max (ns)  StdDev (ns)                                                  Name
 --------  ---------------  ---------  ---------  ---------  --------  --------  -----------  ----------------------------------------------------------------------------------------------------
     15.6    3,751,327,650      8,406  446,267.9  637,700.0    26,976   649,251    278,936.9  void cutlass::Kernel<cutlass_tensorop_s1688dgrad_optimized_tf32_128x128_16x4_unity_stride>(T1::Para…
      8.1    1,945,776,423      2,802  694,424.1  694,723.0   349,026   699,235      9,275.9  void cutlass::Kernel<cutlass_tensorop_s1688dgrad_optimized_tf32_256x64_16x4_unity_stride>(T1::Param…
      7.4    1,766,814,457      2,800  631,005.2  631,011.0   628,227   635,075      1,072.4  ampere_scudnn_128x64_stridedB_splitK_xregs_large_nn_v1
      7.3    1,758,463,791     11,200  157,005.7  167,121.0   142,561   187,937     12,874.6  void implicit_convolve_sgemm<float, float, (int)1024, (int)5, (int)5, (int)3, (int)3, (int)3, (int)…
...
Specifically, I am interested to see which part of the source code calls ampere_scudnn_128x64_stridedB_splitK_xregs_large_nn_v1. I guess this is part of CuDNN and the final name is created by wrappers. In the end, somewhere in the code (PyTorch), there should be a C++ function that invokes a kernel with <<<>>> format.
I don’t believe that the backtraces are part of the standard stats report.
If you open the GUI, hovering over a kernel will show you the backtrace.
@jkreibich do we have a stats script that outputs the CUDA backtraces?
None of the stats reports utilize backtrace information. It would be difficult to represent in table format. We might be able to do it as part of a trace report, but I don’t think it would be possible with a summary report such as these.
Using the GUI, I see a page like this:
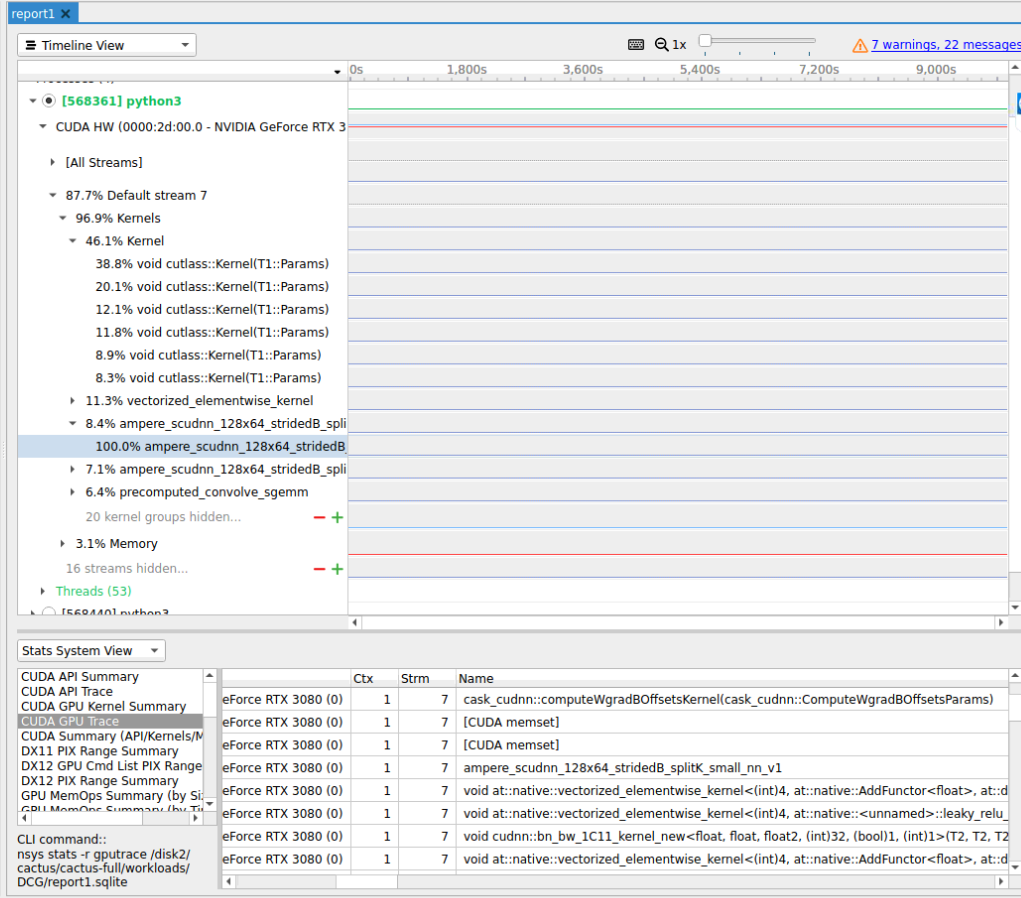
Here, I see the end kernel names. Let me state my question in another way. I would like to see which data structure is passed to a specific kernel like ampere_scudnn...? With a call stack, I am able to follow the the chain of upper callers and see which data structure is passed to the kernel. For simple codes, it is possible to find the <<<>>> kernel invocations. However, for library-based codes, e.g. mlperf, it is much more complicated than my expectations. Any idea about that?
This isn’t available with Nsight Systems.