I’m working on measuring the DDR memory usage of a ResNet model running on the Orin platform, and I’d like to verify whether my measurements are accurate.
I’m profiling the resnet trt engine with
sudo /opt/nvidia/nsight-compute/2024.3.0/ncu --section SpeedOfLight --section MemoryWorkloadAnalysis_Tables --metrics group:memory__dram_table --csv /usr/src/tensorrt/bin/trtexec --loadEngine=resnet.engine --iterations=1 > resnet.csv
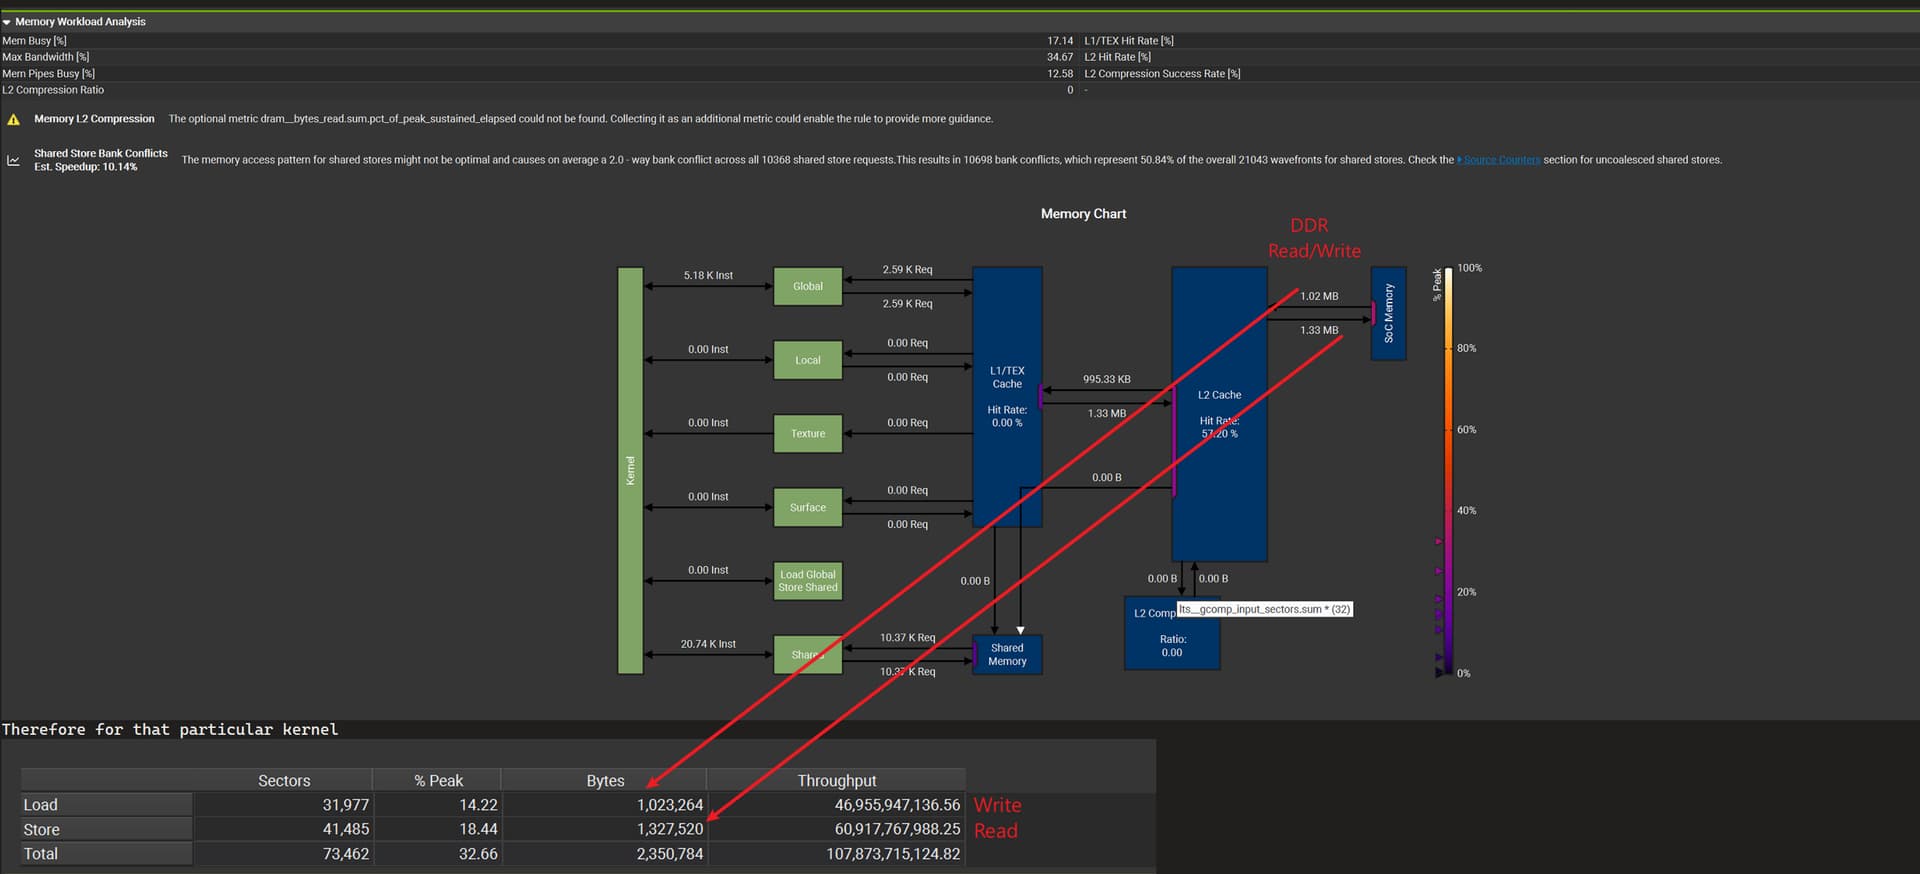
From what I understand the DDR is as below:
Now if I sum all the lts__t_sectors_aperture_sysmem_op_write.sum and lts__d_sectors_fill_sysmem.sum and convert it to bytes. I get something like
So the DDR BW = Total Read+Write(Bytes) /Resnet-Latency(ms). Have I misunderstood anything or is there a better way to profile this, kindly advice. Thanks in advance.
Hello,
Thanks for visiting the NVIDIA Developer forums.
Your topic will be best served in the Jetson category, I have moved this post for better visibility.
Cheers,
1 Like
Hi,
Do you want to know the bandwidth of the system?
For a particular use case, you can measure the read/write required for the app.
For calculating bandwidth, you can refer to our sample below:
              sdkStartTimer(&timer);
              checkCudaErrors(
                  cudaMemcpy(h_odata, d_idata, memSize, cudaMemcpyDeviceToHost));
              sdkStopTimer(&timer);
              elapsedTimeInMs += sdkGetTimerValue(&timer);
              sdkResetTimer(&timer);
              memset(flush_buf, i, FLUSH_SIZE);
            }
          }

          // calculate bandwidth in GB/s
          double time_s = elapsedTimeInMs / 1e3;
          bandwidthInGBs = (memSize * (float)MEMCOPY_ITERATIONS) / (double)1e9;
          bandwidthInGBs = bandwidthInGBs / time_s;
          // clean up memory
          checkCudaErrors(cudaEventDestroy(stop));
          checkCudaErrors(cudaEventDestroy(start));
          sdkDeleteTimer(&timer);

          if (PINNED == memMode) {
            checkCudaErrors(cudaFreeHost(h_idata));
Thanks.
But if one is running a trtexec and profiling it; is the above mentioned method a good way to approach the problem.
Thanks.
Hi,
If you want to measure the bandwidth of a specific app, you can profile it with the Nsight tool.
Thansk.
Understood, and that is what I have used as you can see from the question posted. Pasting the image again here for your perusal.
Hi,
Thanks, that will be the bandwidth of the specific use case.
Are you able to calculate the score by referring to the CUDA sample shared above?
system
August 27, 2025, 2:30am
11
This topic was automatically closed 14 days after the last reply. New replies are no longer allowed.