Hi, I’m analyzing runtime of my CUDA implementation.
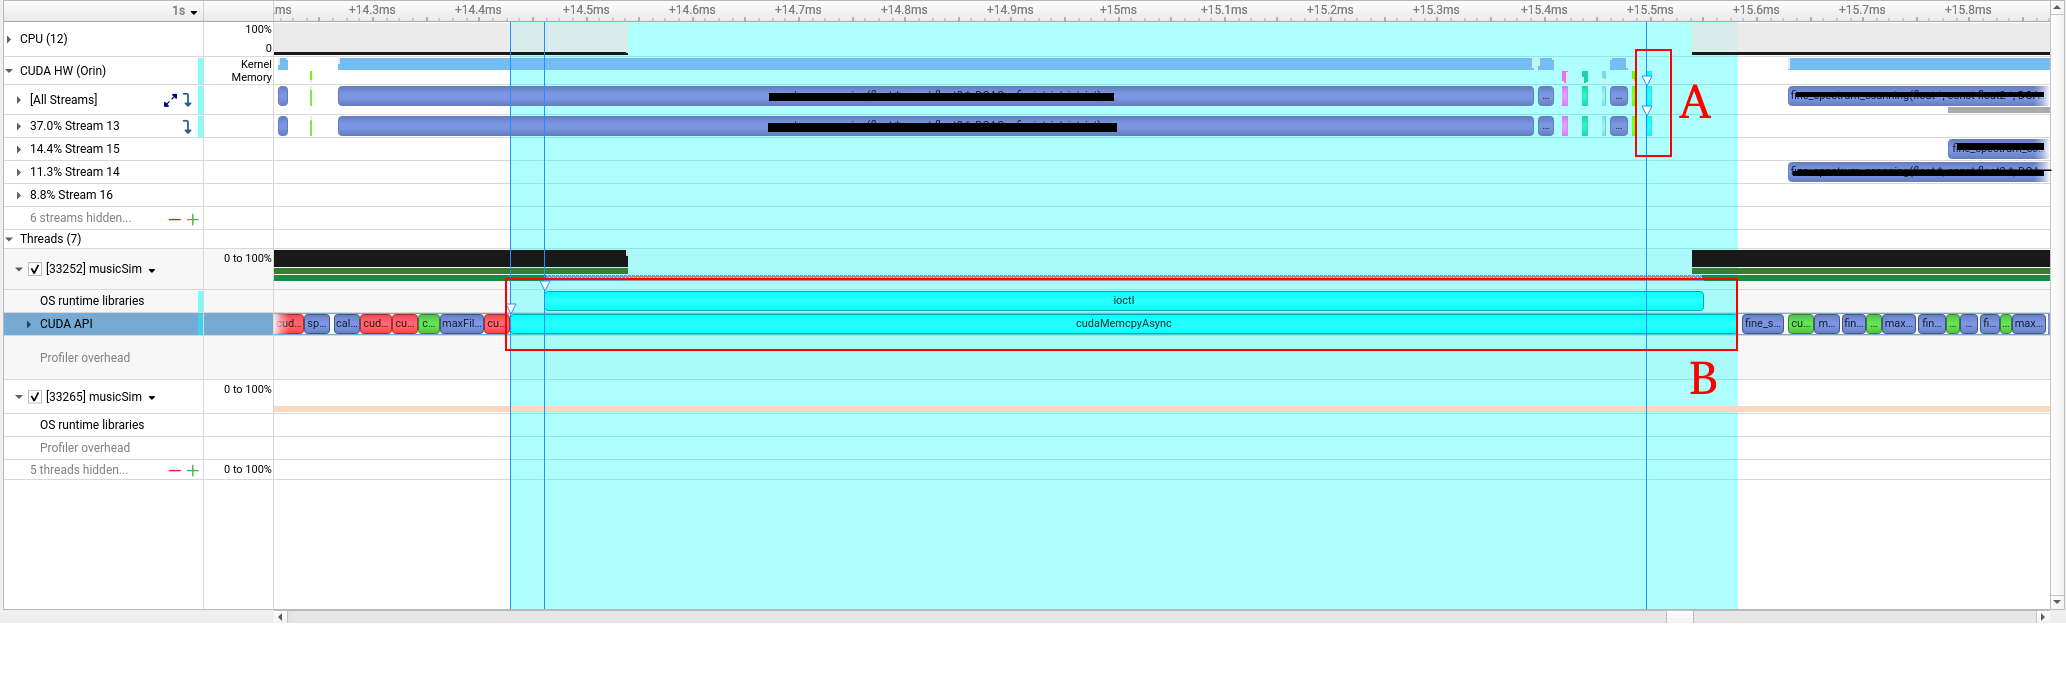
I put two tags A and B in the screenshot.
A demonstrates the CUDA HW, and B demonstrates the CUDA API.
Both are for the same memory copy async process.
As we can see from the GUI, A is short but B is extremely long.
How to know the meaning of A and B?
Which one stands for the real runtime cost of the async memory copy?
Does the begin and the end of the GUI stripe mean the start and the end of the API call?
Thanks!
When you click on a kernel in the Nsight Systems GUI on the CPU or GPU timelines, we color in teal all of the work associated with that kernel. In this case you have the work in B, which is the work (or time blocked) on the CPU side, and the work in A, which is the work (or time blocked) on the GPU side.
It is hard to tell much from a screenshot, but I wonder if you were calling for an async memory copy while using pageable memory. You can check by using the expert systems rule for this. Go to the events pane (below the timeline) click on the expert systems, and run this rule:
1 Like
Yes, this is an async memory copy using pageable memory.
My point is that If I focus on B, I would consider it a bottleneck because of its length, but if I focus on A, I wouldn’t.
Also, I checked the event pane.
Each duration of async memory copy with pageable memory is about 4~7 us.
What suggestions do you have for this?
Thanks!
Using pageable memory puts an inherent synchronization in the process. The memory can’t actually be copied “async” because the memory it is writing to might be paged away. If possible, shift to using pinned memory.
Bottleneck analysis basically means not only looking at how long something is taking, but also how much other things are waiting for it. From your screen shot, it looks like the streams that you are using on the one GPU are pretty well subscribed. There is some empty cycles, but it’s not too bad. So whether it is worth improving this particular call depends on what else you could get done in that time.
And pinned memory is not without it’s cost. If you hover on the ioctl call on the OS runtime library line, you will get the backtrace of that ioctl call, that might give you some insight into other patterns.
1 Like