Nvprof and visual profiler about memory and cache access?

Hello, I have a Jetson nano. I want to run a deep learning inference program in it and analyze its memory access. The inference program is executed by the python 3 interpreter, which inputs a picture into the built-in neural network of torch, such as resnet50, and outputs the inference result.

Question: I want to know how much memory is accessed by the data from DRAM to L2, then to L1, and then to the kernel when the program is running.

Here is my analysis process:

I plan to use nvprof to analyze the program.

Because it is CC5 3. Therefore, it is not supported to collect the memory accesses from DRAM to L2, as shown in the figure below (reference:CUDA Toolkit V11.61.
)


however, according to the output of nvprof – query metrics, as shown in the following figure:

I can collect gld_transactions, converted to MB (gld_transactions * 4 / 1024 / 1024 (MB)), can it represent the number of bytes read by the kernel from L1 cache?

And L2_ global_ load_ Bytes, converted to MB (l2_global_load_bytes / 1024 / 1024 (MB)), can it represent the number of bytes read by L1 from L2?

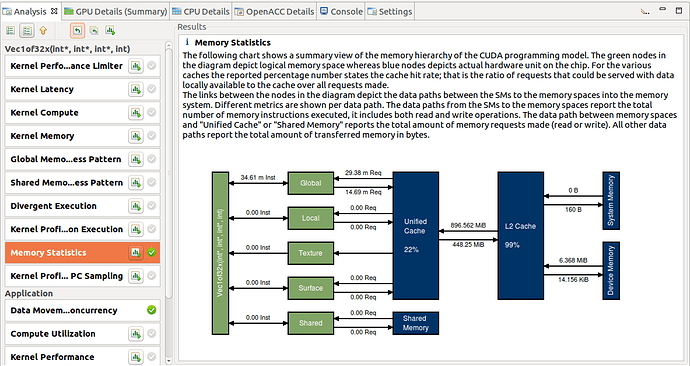
Since nvprof’s metrics cannot collect the amount of DRAM memory accessed by L2, I found the visual profiler tool in the previous link, which can analyze the memory flow:


However, I found that the article pointed out that the Jetson nano cannot directly use visual Profiler:

So when I execute the program, I use the following statements:

sudo /usr/local/cuda/bin/nvprof -o tf-resnet50.nvvp python3 resnet50-infer.py

Save the analysis results to tf-resnet50.nvvp, use the same version of visual profiler on the PC to tf-resnet50.nvvp analysis yielded the following results:

Does the total bytes shown in the bottom right corner of memcpy (htod) represent the amount of memory accessed by L2 cache from DRAM?If yes, the value corresponding to memcpy (htod) can be collected in Jetson nano using nvprof – which metric in query metrics?Because the data of visual profiler is collected by nvprof.

![|553x17](file:///C:\Users\22163\AppData\Local\Temp\ksohtml\wpsE7CE.tmp.jpg)

It can be summarized into three questions:

(1) gld_transactions, converted to MB (gld_transactions * 4 / 1024 / 1024 (MB)), can it represent the number of bytes read by the kernel from L1 cache?

(2)l2_ global_ load_ Bytes, converted to MB (l2_global_load_bytes / 1024 / 1024 (MB)), can it represent the number of bytes read by L1 from L2?

(3) Does memcpy (htod) in visual profiler represent the amount of data read from DRAM by L2 cache? If yes, the value corresponding to memcpy (htod) can be collected in Jetson nano using nvprof – which metric in query metrics?

These questions have bothered me for a long time. If you can answer them patiently, I will be very grateful.

Hi,

There are some related events in the Nsight System.
Does it help for your profiling?

$ sudo nsys profile --cpu-core-events=help
Possible --cpu-core-events values are:
'0x00' Software increment. The register is incremented only on writes to the Software Increment Register (ARM/SW_INCR),
'0x01' L1 Instruction cache refill (ARM/L1I_CACHE_REFILL),
'0x02' L1 Instruction TLB refill (ARM/L1I_TLB_REFILL),
'0x03' L1 Data cache refill (ARM/L1D_CACHE_REFILL),
'0x04' L1 Data cache access (ARM/L1D_CACHE),
'0x05' L1 Data TLB refill (ARM/L1D_TLB_REFILL),
'0x06' Instruction architecturally executed, condition check pass - load (ARMv8/LD_RETIRED),
'0x07' Instruction architecturally executed, condition check pass - store (ARMv8/ST_RETIRED),
'0x08' Instruction architecturally executed (ARM/INST_RETIRED),
'0x09' Exception taken (ARM/EXC_TAKEN),
'0x0a' Exception return (ARM/EXC_RETURN),
'0x0b' Change to Context ID retired (ARM/CID_WRITE_RETIRED),
'0x0c' Instruction architecturally executed, condition check pass - write to CONTEXTIDR (ARMv8/PC_WRITE_RETIRED),
'0x0d' Instruction architecturally executed, condition check pass - software change of the PC (ARMv8/BR_IMMED_RETIRED),
'0x0f' Instruction architecturally executed, condition check pass - procedure return (ARMv8/UNALIGNED_LDST_RETIRED),
'0x10' Mispredicted or not predicted branch speculatively executed (ARM/BR_MIS_PRED),
'0x11' Cycle (ARM/CPU_CYCLES),
'0x12' Predictable branch speculatively executed (ARM/BR_PRED),
'0x13' L1 Data cache access (ARM/MEM_ACCESS),
'0x14' L1 Instruction cache access (ARM/L1I_CACHE),
'0x15' L1 Data cache Write-Back (ARM/L1D_CACHE_WB),
'0x16' L2 Data cache access (ARM/L2D_CACHE),
'0x17' L2 Data cache refill (ARM/L2D_CACHE_REFILL),
'0x18' L2 Data cache Write-Back (ARM/L2D_CACHE_WB),
'0x19' Bus access (ARM/BUS_ACCESS),
'0x1a' Local memory error (ARM/MEMORY_ERROR),
'0x1d' Bus cycle (ARM/BUS_CYCLES),
'0x1e' Odd performance counter chain mode (ARMv8/CHAIN),
'0x60' Bus access - Read (ARM/BUS_ACCESS_LD),
'0x61' Bus access - Write (ARM/BUS_ACCESS_ST),
'0x7a' Branch speculatively executed - Indirect branch (ARM/BR_INDIRECT_SPEC),
'0x86' Exception taken, IRQ (ARMv8/EXC_IRQ),
'0x87' Exception taken, FIQ (ARMv8/EXC_FIQ),
'0xc0' External memory request (ARMv8/Unnamed_C0),
'0xc1' Non-cacheable external memory request (ARMv8/Unnamed_C1),
'0xc2' Linefill because of prefetch (ARMv8/Unnamed_C2),
'0xc3' Instruction Cache Throttle occurred (ARMv8/Unnamed_C3),
'0xc4' Entering read allocate mode (ARMv8/Unnamed_C4),
'0xc5' Read allocate mode (ARMv8/Unnamed_C5),
'0xc6' Pre-decode error (ARMv8/Unnamed_C6),
'0xc7' Data Write operation that stalls the pipeline because the store buffer is full (ARMv8/Unnamed_C7),
'0xc8' SCU Snooped data from another CPU for this CPU (ARMv8/Unnamed_C8),
'0xc9' Conditional branch executed (ARMv8/Unnamed_C9),
'0xca' Indirect branch mispredicted (ARMv8/Unnamed_CA),
'0xcb' Indirect branch mispredicted because of address miscompare (ARMv8/Unnamed_CB),
'0xcc' Conditional branch mispredicted (ARMv8/Unnamed_CC),
'0xd0' L1 Instruction Cache (data or tag) memory error (ARMv8/Unnamed_D0),
'0xd1' L1 Data Cache (data, tag or dirty) memory error, correctable or non-correctable (ARMv8/Unnamed_D1),
'0xd2' TLB memory error (ARMv8/Unnamed_D2),
'0xe0' Attributable Performance Impact Event. Counts every cycle that the DPU IQ is empty and that is not because of a recent micro-TLB miss, instruction cache miss or pre-decode error (ARMv8/Unnamed_E0),
'0xe1' Attributable Performance Impact Event. Counts every cycle the DPU IQ is empty and there is an instruction cache miss being processed (ARMv8/Unnamed_E1),
'0xe2' Attributable Performance Impact Event. Counts every cycle the DPU IQ is empty and there is an instruction micro-TLB miss being processed (ARMv8/Unnamed_E2),
'0xe3' Attributable Performance Impact Event. Counts every cycle the DPU IQ is empty and there is a pre-decode error being processed (ARMv8/Unnamed_E3),
'0xe4' Attributable Performance Impact Event. Counts every cycle there is an interlock that is not because of an Advanced SIMD or Floating-point instruction, and not because of a load/store instruction waiting for data to calculate the address in the AGU. Stall cycles because of a stall in Wr, typically awaiting load data, are excluded (ARMv8/Unnamed_E4),
'0xe5' Attributable Performance Impact Event. Counts every cycle there is an interlock that is because of a load/store instruction waiting for data to calculate the address in the AGU. Stall cycles because of a stall in Wr, typically awaiting load data, are excluded (ARMv8/Unnamed_E5),
'0xe6' Attributable Performance Impact Event. Counts every cycle there is an interlock that is because of an Advanced SIMD or Floating-point instruction. Stall cycles because of a stall in the Wr stage, typically awaiting load data, are excluded (ARMv8/Unnamed_E6),
'0xe7' Attributable Performance Impact Event. Counts every cycle there is a stall in the Wr stage because of a load miss (ARMv8/Unnamed_E7),
'0xe8' Attributable Performance Impact Event. Counts every cycle there is a stall in the Wr stage because of a store. (ARMv8/Unnamed_E8),
'none'.

Thanks.

Thank you very much for your answer, but these indicators seem to be CPU? What I need to know is the indicators that nvprof in GPU can collect? If my problem description is not clear enough, I am happy to re describe it, because this problem is too important to me, thank you!

Well, maybe you can answer the third question first: which metrics nvprof collects for memcpy (htod) in the analysis result of visual profiler. For example, you can answer: the value of memcpy (htod) in visual profiler is through nvprof - M XXX python3 resnet50.py collected. What I need to know is this XXX thank you!Maybe you can ask nvprof or visual profiler engineers for help?

Is there any relevant solution to this problem?

Using nsight system, where can I find the exact number of occurrences of these events?
In the GUI, I can only find out the graph but not exact results.

It seems that they won’t answer this question for the time being.

Hi,

Sorry that we don’t provide the GPU L1/L2 cache profiling.
The total bytes you see in the NVVP is the amount that memcpy copied.

Thanks.

1 Like

Thank you very much for your reply!

The last two questions of this forum are:

(1) Which metrics in nvprof can be used to obtain the memcpy (htod) and memcpy (dtoh) values in nvvp?

(2) Can the value of memcpy (htod) + memcpy (dtoh) + represent the amount of memory exchanged between DRAM and cache?

Hi,

1. You can use the --metrics all configuration to get all the available data.

2. No. It’s the amount that transfers between the CPU buffer and GPU buffer.
Not related to the cache.

Thanks.

This topic was automatically closed 14 days after the last reply. New replies are no longer allowed.