Performance degradation as task size grows

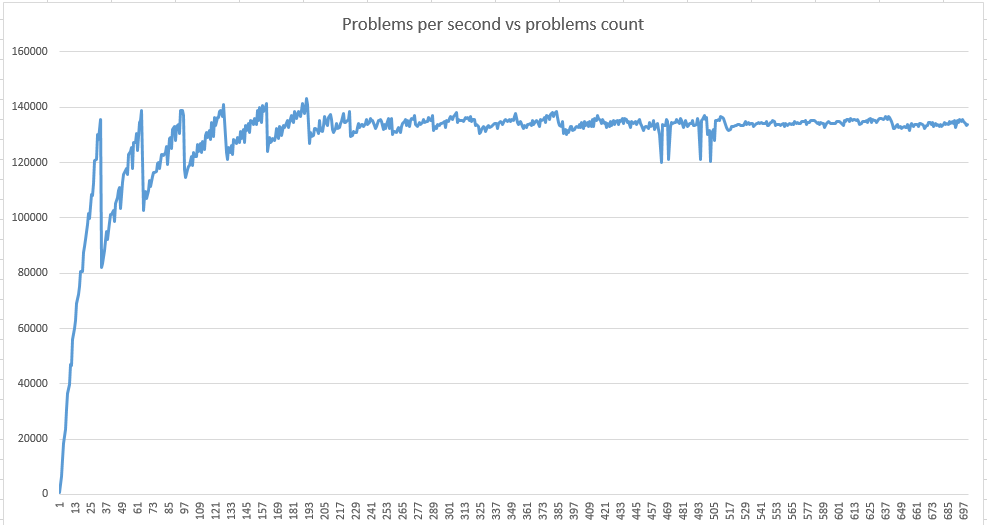
I am writing a code to solve the lamé equation for anisotropic waveguides and have come across the following situation. The performance of the code that calculates the part of the green matrix drops after a certain task size is reached.
I understand why performance is jagged at small sizes - it’s tail effects, but what causes the drop at large sizes? In my understanding, performance should asymptotically tend to peak with growth in size.

CUDA 11.8 Win 10 GTX1080 (PC)
CUDA 11.8 Win 10 GTX840M (Laptop)

part of my code


#define hv _host_ void 

hv test_speed_new_v3(int lo = 1, int hi = 1025, int step = 1, int repetitions = 10)
{
//global variables, nothing interesting
	timer_data_ timer;

	t_device_config device;
	t_math_solver_configs  solver;
	int dim1 = 1;
	int dim2 = 1;
	float default_override = 4;

	int layers = 1;

	int mesh_kind = MESH_GAMMA_ALPHA;
	cuDoubleComplex g1 = make_cuDoubleComplex(1.000000, 0.0);
	cuDoubleComplex g2 = make_cuDoubleComplex(1.000001, 0.0);
	cuDoubleComplex a1 = make_cuDoubleComplex(1.0, 0.0);
	cuDoubleComplex a2 = make_cuDoubleComplex(10.0, 0.0);

	double m__ = 1;
	cuDoubleComplex omega = make_cuDoubleComplex(0.628 * m__, 0.0 * m__);
	cuDoubleComplex z = make_cuDoubleComplex(0.0, 0.0);

	float override_ = default_override;
	int smem = 64 * 1024;
	int th = 128;
	int regs = 128 * 1024;
	int preset = NO_PRESET_BLOCKS;

	int thuse;
	int smemuse;
	int reguse;

	t_math_solver_configs* solver_on_device;

	device_init(device);
	init_empty_vals(device);
	cuda_streams_init(device);

	init_timer(&timer);

	cudaMalloc(&solver_on_device, sizeof(t_math_solver_configs));
	cuda_check(cudaDeviceSynchronize());

//this part is measuring time for different problems
	for (int cur_pc = lo; cur_pc < hi; cur_pc += step)
	{
		solver.dim1 = dim1;
		solver.dim2 = cur_pc ;

//allocating mem
		build_spec_pools_Nxlay_v3_expandedME(device, solver, 1);

		cudaMemcpy(solver_on_device, &solver, sizeof(t_math_solver_configs), cudaMemcpyHostToDevice);

//initialize physic constants
		k1x1_init_com0_1l_caller << <1, 1 >> > (solver_on_device);

		thuse = 32;
		reguse = 110;
		smemuse = 1024;
		int blocks = GetBlocksCountf4(device.device_SM, smem, smemuse, th, thuse, regs, reguse, override_, dim1 * dim2, preset);

//generate mesh
		knxm_generate_points_v2 << <blocks, 32 >> > (solver_on_device, g1, g2, a1, a2, omega, z, dim1, dim2, mesh_kind);
		cudaMemcpy(&solver, solver_on_device, sizeof(t_math_solver_configs), cudaMemcpyDeviceToHost);

		start_timer(&timer);

//time consuming part
		for (int rep_id = 0; rep_id < repetitions; rep_id++)
		{
			k1x1_smart_launch_ENEV << <1, 1 >> > (solver_on_device, dim1 * dim2 * layers, device.device_SM);
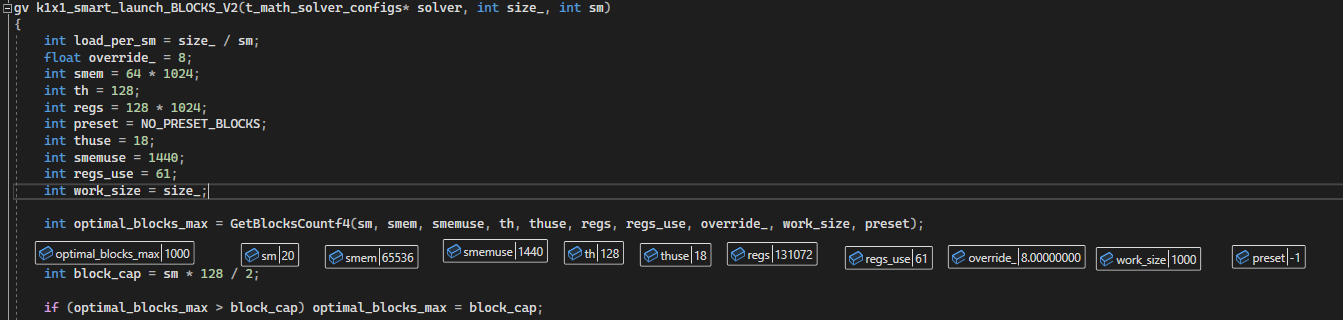
			k1x1_smart_launch_BLOCKS_V2 << <1, 1 >> > (solver_on_device, dim1 * dim2, device.device_SM);
			k1x1_smart_launch_SOLVER << <1, 1 >> > (solver_on_device, dim1 * dim2, device.device_SM);
		}

		double elapsed = stop_timer_avg(&timer, (double)repetitions);

		double points_per_sec = ((double)dim2 * 1000000) / elapsed;

		printf("count %d elapsed %lf us perf pps %lf \n", dim2, elapsed, points_per_sec);

		deallocate_pool(device, solver.multi_pool);
		cuda_check(cudaDeviceSynchronize(), "post cycle check", true, __FILE__, __LINE__);
	}
	kill_timer(&timer);
	device_release(device);
}

code for timer


#define hv _host_ void 

struct timer_data_
{
	double executed_us;
	cudaEvent_t start, stop;
};


hv init_timer(timer_data_* timer)
{
	cuda_check(cudaEventCreate(&timer->start));
	cuda_check(cudaEventCreate(&timer->stop));
}

hv start_timer(timer_data_* timer)
{
	cuda_check(cudaEventRecord(timer->start, 0));
	cuda_check(cudaEventRecord(timer->stop, 0));
}

__host__ double stop_timer(timer_data_* timer)
{
	float time;
	cuda_check(cudaEventRecord(timer->stop, 0));
	cuda_check(cudaEventSynchronize(timer->stop));
	cuda_check(cudaEventElapsedTime(&time, timer->start, timer->stop));
	timer->executed_us = (double)time / 1000.0;
	return timer->executed_us;
}

__host__ double stop_timer_avg(timer_data_* timer, double avg)
{
	float time;
	cuda_check(cudaEventRecord(timer->stop, 0));
	cuda_check(cudaEventSynchronize(timer->stop));
	cuda_check(cudaEventElapsedTime(&time, timer->start, timer->stop));
	timer->executed_us = ((double)time * 1000.0) / avg;
	return timer->executed_us;
}
 
__host__ void kill_timer(timer_data_* timer)
{
	cuda_check(cudaEventDestroy(timer->start));
	cuda_check(cudaEventDestroy(timer->stop));
}

UPD: GPU temperature stays low during computing ~50-55 degrees Celsius

Is this what you are measuring on the y axis?

If so (yikes!), there is nothing about a tail effect that applies to any of that.

More generally, you might want to explain how the x and y axis variables are derived from the code you have shown. Regarding the x axis, for me, anyway, “problems” or “problems count” is not self-evident from the code you have shown.

On y axis is measured followng value - how many samples can my GPU process per second
samples per sec = 1000000 / (elapsed in us / (dim1*dim2 ) )
On x axis is followng value - samples count in my test
'samples/10' = dim1*dim2/10
I made an excel spreadsheet and calculated the performance by copying the output of my program there.

kernel launches of <<<1,1>>> are generally not a performant way to use a GPU. There is no tail effect with a kernel launch of <<<1,1>>>.

It’s just laucher for child grid, that decide what exactly to call, its done to call more efficient versions on small tasks

gv k1x1_smart_launch_BLOCKS_V2(t_math_solver_configs* solver, int size_, int sm)
{
	int load_per_sm = size_ / sm;
	float override_ = 8;
	int smem = 64 * 1024;
	int th = 128;
	int regs = 128 * 1024;
	int preset = NO_PRESET_BLOCKS;
	int thuse = 18;
	int smemuse = 1440;
	int regs_use = 61;
	int work_size = size_;

	int optimal_blocks_max = GetBlocksCountf4(sm, smem, smemuse, th, thuse, regs, regs_use, override_, work_size, preset);


	int block_cap = sm * 128 / 2;

	if (optimal_blocks_max > block_cap) optimal_blocks_max = block_cap;

	if (load_per_sm >= 28)
	{
		k18xm_32b_blocks_reverse_ext_v4 << <optimal_blocks_max, 18 >> > (solver);
		return;
	}

	if (load_per_sm >= 24)
	{
		k18xm_28b_blocks_reverse_ext_v4 << <size_, 18 >> > (solver);
		return;
	}

	if (load_per_sm >= 20)
	{
		k18xm_24b_blocks_reverse_ext_v4 << <size_, 18 >> > (solver);
		return;
	}

	if (load_per_sm >= 16)
	{
		k18xm_20b_blocks_reverse_ext_v4 << <size_, 18 >> > (solver);
		return;
	}

	if (load_per_sm >= 12)
	{
		k18xm_16b_blocks_reverse_ext_v4 << <size_, 18 >> > (solver);
		return;
	}

	if (load_per_sm >= 8)
	{
		k18xm_12b_blocks_reverse_ext_v4 << <size_, 18 >> > (solver);
		return;
	}

	k18xm_8b_blocks_reverse_ext_v4 << <size_, 18 >> > (solver);
	return; 
}

This code will lauch grid <<<min (sm *max_possible_per_sm, dim1 * dim2) ,18>>>
18 thread usage caused by 3x6 and 6x6 small matrix calculations
difference is in launch bounds:

#define gv global void
gv  __launch_bounds__(18, 32)   k18xm_32b_blocks_reverse_ext_v4(t_math_solver_configs* solver)
{
...
}

gv  __launch_bounds__(18, 24)   k18xm_24b_blocks_reverse_ext_v4(t_math_solver_configs* solver)
{
...
}


__host__ int  GetBlocksCountf4(int sm, int smem, int smemuse, int th, int thuse, float regs, float regs_use, float override_, int work_size, int preset)
{
	float smemlim = 1024 * 1024;
	if (smemuse > 0)  smemlim = (float)smem / (float)smemuse;
	float thlim = (float)th / (float)thuse;
	float reglim = (float)regs / (float)(regs_use * thuse);
	if (smemlim < thlim) thlim = smemlim;
	if (reglim < thlim) thlim = reglim;
	if (thlim > 32) thlim = 32;

	int blocks = (int)((float)sm * (thlim * override_));

	if (blocks > work_size) blocks = work_size;
	if (preset > 0) blocks = preset;

	return blocks;
}

picture for elapsed time
y axis - elapsed time per repetition in us
x axis -'samples/10' = dim1*dim2/10

18 threads per block is also not particularly good for a GPU. Launching 32x18 threads per block may be better. You may still have “occupancy quantization” going on, which might lead to the performance concern here.

There’s enough levels of abstraction here that I wasn’t able to figure out grid dimensions for the cases around dim1*dim2=500

What is “occupancy quantization”? I can’t find it on google
I am running up to 24 * sm blocks with 18 threads grids on my GPU for this kernel (BLOCKS_V2 ).
like <<< blocks = 1000, 18>>> in the previous example
Interestingly, I’ve found that the efficiency stars drop as I get closer to cuda’s core count.
So if i get you right your idea is try to improve kernels using N*18 threads instead of 18 threads per block?
One of the problems with my code is that it is “related to math formulas” - the choice of threads and algorithms is directly related to the math formulas I’m implementing, so choosing different threads is not that easy, but I can try to do something in this appeal

Its a term I just made up. Occupancy is the idea of the GPU carrying as much workers as possible. Full occupancy means the GPU is carrying as many workers (e.g. threads) as is possible.

Quantization refers to the idea that if you integer divide one number by another number, then depending on the actual numerator and denominator, the difference between the integer result and actual result may vary, due to quantization - expressing a result in fixed size units. (I’m sure there are better definitions of quantization - this will suffice in my view.)

So this “division” comes about when we take the full occupancy, (to be arbitrary - the number does not matter) let’s say 2048 threads, and divide that by the denominator - the number of threads per threadblock. We use integer division because the GPU does not express or launch fractional threadblocks. If the number of threads per threadblock is 512, the difference between the integer result (4) and the actual result (4) is zero. OTOH if the number of threads per threadblock is 513, the difference between the integer result (3) and the actual result (3.9922…) is not zero. This “quantization” effect can limit your achieved occupancy, which can limit your performance. If you take a kernel and plot the throughput vs. threadblock size, varying from say 1 to 1024 or something like that, you will often see a stepped performance curve, not unlike your plots.

As a separate topic:

A threadblock that has 18 threads (only) in it will, to a first order approximation, and based on that piece of information only, waste ((32-18)/32)*100% = 44% of your GPU horsepower. Launching any number of such blocks does not change that fact or arithmetic.

A threadblock that has 18x32 threads in it will, to a first order approximation, waste 0% of GPU resources, again considering only that datum.

There are probably additional grid sizing criticisms we could make (note that even 18x32 threads may still be a factor for the occupancy considerations mentioned above), but that one (18 threads per warp/block) in particular is probably the largest single performance factor to be concerned about “on paper”.

1 Like

So I have to try something like this
cool_kernel <<<blocks, 18*32>>>(data)

cool_kernel  ( )
{
int tid = threadIds.x; 
int virtual_tid = tid% 18 ;
int virtual_block = tid /18;
// other code
}

It’s possible option for two of my three kernels, the first will be more difficult due to the use of shared memory

I don’t know what the performance limiters are for your case. The most promising approach IMO is to use analysis-driven optimization in order to improve the performance of your application.

But for me, personally, I would certainly question whether a threadblock size of 18 threads may possibly be a limiter to performance. It’s not recommended in any typical CUDA beginner training.

1 Like

I already tried to optimize code
I did analysis, so mostly its latency and global memory, as I did understand. in all cases 66% of latency also memory latency (~)
ENEV :
occupancy 24.9/ 50% max (visual profiler)
global mem throughput about 73Gb/s, max 320

Blocks
occupancy 22.5/ 50% max (visual profiler)
global mem throughput about 103Gb/s, max 320

solver 24.9/ 50% max (visual profiler)
global mem throughput about 110Gb/s achived to 320 max Gb/s

so as I understand your basic idea here is to improve grid and probably vectorize my global memory loads

I am trying to rewrite the first of my functions (eigensolver) to 54 threads per block instead of 9 (then I will probably increase the number of warps per block), as I see from the tests, I can probably achieve a speedup of 3-5 times depending on the ratio between the size tasks and the performance limit of a particular video card (more is better). Further, I will probably apply the technique described here for other kernels. Thanks Robert, issue resolved.

This topic was automatically closed 14 days after the last reply. New replies are no longer allowed.