Profiling my code I need some help to understand the output of the visual profiler

I am trying to profile my code. My program is doing a MC simulation of particles with long range interaction. Every time a particle is move N interactions are computed. There are 2 kernels which do the job, one which calculates the N interaction and 1 which makes the sum and decides acceptance or rejection. Because my problem is not large enough to fill the gpu I use 4 streams with almost not performance loss.

I need some help to understand the information given by the visual profiler.

First I have to mentioned that one my kernels is using 38 registers which gives for 256 threads /block an occupancy of 50%. I tried to play around with the number of registers to increase the occupancy (mainly trying to use mixed precision instead of all double precision), but there was no performance improvements.

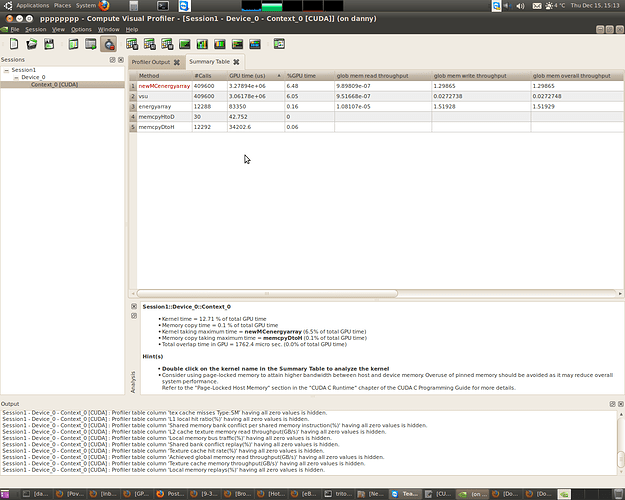
The 2 kernels take 12 % of the total gpu time and global memory output as 1.29. Are these numbers good or bad?

I attached a print of the main window from the profiler.

If I double-click on the kernel which makes most work I get this message

As the report (and the User’s Guide for the Profiler, by the the way) clearly state, global memory throughput (not output) for both read and write is in GB/sec.

As to what’s ‘good’, I shoot for 50-80% of a card’s theoretical maximum. Getting more than that means a lot more work in hours to get increasingly less performance output (unless you’re a grad student…). For your card (C2070), the theoretical max is 155 GB/sec. (Thank you Wiki). So your ‘Achieved’ number of 1.3 is a little slow compared to 144 (especially the write). Did you notice the report telling you your Achieved is low compared to peak of 143.2 GB/sec, and the recommendations it makes?

You should also download the Excel Occupancy calculator, which will indicate what is limiting your occupancy after you enter things like the compute level for your card, the number of thread, shared memory, registers used, etc.

Hello,

Thank you for your reply. My occupancy is 50 %, because the kernel is using 38 registers. I tried to reduce the number below 32 by using a mixed float-double precision, but the performance was lower. I am a little confused about this.

For the memory it gives these hints:

Consider using shared memory as a user managed cache for frequently accessed global memory resources.

Refer to the "Shared Memory" section in the "CUDA C Runtime" chapter of the CUDA C Programming Guide for more details. 

The achieved global memory throughput is low compared to the peak global memory throughput. To achieve closer to peak global memory throughput, try to 

Launch enough threads to hide memory latency (check occupancy analysis);

Process more data per thread to hide memory latency;

Consider using texture memory for read only global memory, texture memory has its own cache so it does not pollute L1 cache, this cache is also optimized for 2D spatial locality.

Refer to the "Texture Memory" section in the "CUDA C Runtime" chapter of the CUDA C Programming Guide for more details.

For the limiting factor I got this:

Summary profiling information for the kernel: 

Number of calls:  409600

Minimum GPU time(us):  0.90

Maximum GPU time(us):  10.24

Average GPU time(us):  8.01

GPU time (%):  6.48

Grid size:  [4  1  1]

Block size:  [256  1  1]

Limiting Factor

Achieved Instruction Per Byte Ratio:  39.88 ( Balanced Instruction Per Byte Ratio:  3.58 )

Achieved Occupancy:  0.16 ( Theoretical Occupancy:  0.50 )

IPC:  0.81 ( Maximum IPC:  2 )

Achieved global memory throughput:  1.30 ( Peak global memory throughput(GB/s):  143.42 )

Hint(s) 

The achieved instructions per byte ratio for the kernel is greater than the balanced instruction per byte ratio for the device. Hence, the kernel is likely compute bound. For details, click on Instruction Throughput Analysis.

The kernel occupancy is low. For details, click on Occupancy Analysis.

For the occupancy:

Occupancy Analysis for kernel newMCenergyarray on device Tesla C2070

Kernel details: Grid size: [4 1 1], Block size: [256 1 1]

Register Ratio: 0.9375 ( 30720 / 32768 ) [38 registers per thread]

Shared Memory Ratio: 0 ( 0 / 49152 ) [0 bytes per Block]

Active Blocks per SM: 3 (Maximum Active Blocks per SM: 8)

Active threads per SM: 768 (Maximum Active threads per SM: 1536)

Potential Occupancy: 0.5 ( 24 / 48 )

Occupancy limiting factor: Registers

What does it mean “compute bound”?

I will try the textures, though i am not sure how much help will because I am using double precision

You can try to use compiler option – maxregcount to reduce the register count. This may cause spilling the registers but it might still be helpful as the occupancy will increase. Since you are not using shared memory, you can change the cache configuration to prefer L1 so that the register spilling does not cause L1 thrashing and is not expensive.

Your application is compute bound. The occupancy is limited by registers, but you are saying that when you tried lower down the registers using mixed precision, the performance was lowered. This is unexpected, but it is a right step to reduce instructions. Though the code is compute bound, the ipc still seems to be lower (0.8). Check the instruction mix if you are using lot of fp64, transcendental, that have lower throughput.

I don’t know if pasoleatis is still working on this. If he is, the most striking inefficiency is the grid size of only four blocks, which is far too small to load a Tesla 2070 (or almost any other GPU).

Hello,

Thank you for reply. It is true the grid size is small, but my system is as well small. I can compensate by running streams and getting 2 (or more) independent systems running in the same time and giving me more measurements in the same amount of time. I have an inefficient program because number of particles is low, but when I use streams I can still get 50 times more measurements compared to a single core run.