In order to get performance advice it is recommended that you provide a minimal reproducible so that other forum readers can compile, profile, and provide feedback. Without more information on the workload and a reproducible it is difficult to provide help.
Nsight Compute does not show the constant cache data path in the Memory Statistics Diagram. IMC accesses are embedded in the SASS instruction in the form
c[bank][offset]
bank = 0 contains kernel parameters and per grid launch values such as GridDim and BlockDim.
bank = 3 user defined constant values.
A value of 17 cycles for smsp__average_warps_issue_stalled_imc_miss_per_issue_active.ratio may indicate that the kernel is thrashing the constant cache or may mean you have very little work per thread and this is the initial cache miss penalty.
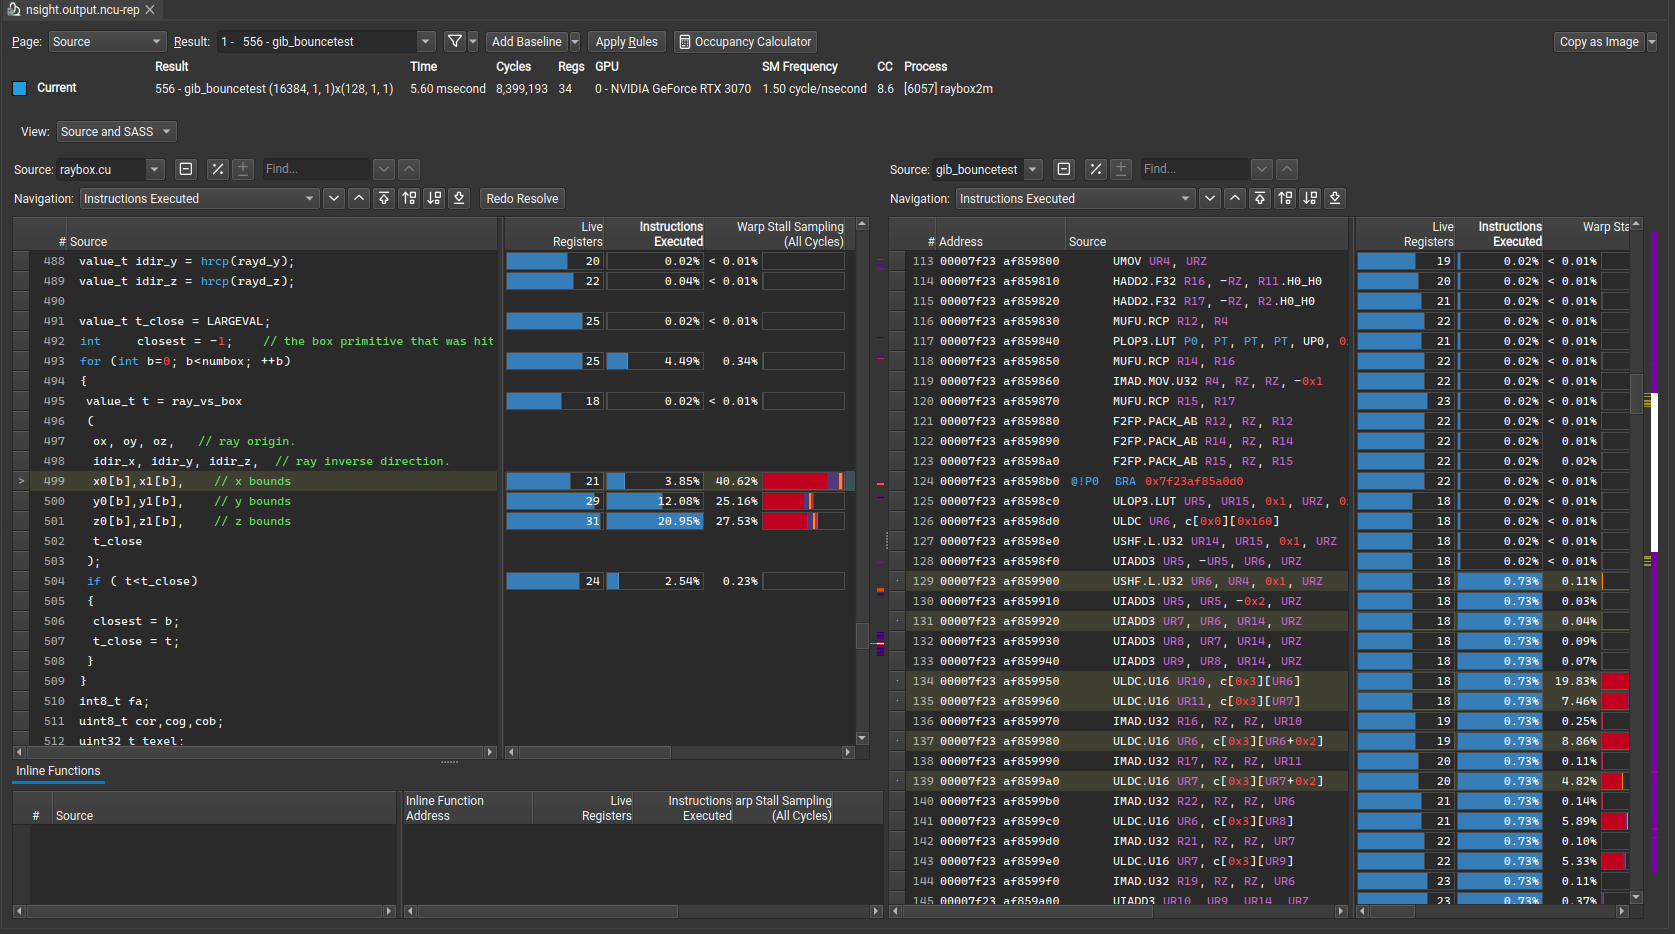
It is possible to find the source lines (or instructions) with the highest stall reasons in the Source View by looking at the Warp Stall Sampling column. If you do not see source code then you need to pass -lineinfo to NVCC when compiling device code in order to generate the line table information.
I do indeed see the lines that cause this issue, and the corresponding instrucions use bank 3.
What I don’t understand is that the cache hit rate is low, because I process the data sequentially. All threads loop the same arrays of constant data. I use 6 arrays in SoA format, all x-values grouped, all y-values, all z-values. All values are fp16.
The ULDC instruction is load the data from the IMC cache into a warp uniform register. The IMAD instructions are being used to move the value from warp uniform register to thread register.
The ULDC instruction has to retire before the next instruction can retire. The IMC cache is per SM sub-partition (4 per SM). The IMC capacity is a few KiB and the cache line size is small. For each loop you will either hit or miss 6 cache lines. When you miss it is likely that all 6 operations will miss. It appears that all warps are doing the same constant reads so it is likely that all warps will stall at the same location.
The IMC cache has a maximum return of 32-bits so by reading fp16 vs. fp16x2 you are only getting 1/2 the B/W.
From the image I cannot tell the size of each array.
The best approach to improving the performance is to make sure you use the full return B/W of the cache. Given the very small number of registers it may be possible to unroll the loop 2x and use fp16x2. This may require padding numboxes. Without restructuring to read more than 16-bit per load I don’t think you will gain from using L1. L1 can return 128B/cycle/SM. In the current code you would be only using 2B/cycle/SM.
I think I made a naive invalid assumption that SoA is always better that AoS.
And although I think that it is important to line-up as SoA for the data you split up between threads, I don’t think I should have used SoA for data that is looped over within a thread.
The latter type of data is probably better served up as x/y/z/x/y/z/… so that it is all nearby in the cache, as opposed to go SoA.
I guess I was trying to make it easier for the cuda compiler to use vector instructions, instead of scalar instructions.
That said, my OpenCL kernel has the exact same code and data layout, and is much faster.
The only real difference is that for the CUDA kernel, I explicitly put some data in __constant__ data, which I do not do for the OpenCL version. I’m not even sure if you can explicitly assign data to the 64KByte read-only cache when using OpenCL?