I am puzzled as to why I cannot get Nsight Systems to work properly. It’s my first time using the profiler and posting here, so excuse me if the question turns out to be banal. I would be very glad if I could get some help.
I am trying to use nsys to analyze my code, however, it shows that my sqlite file doesn’t contain CUDA kernel data when my code does contain kernel function.
I get the following information
en@en-R9000p:~/document/CUDA$ nsys profile --stats=true kernel_abcWarning: LBR backtrace method is not supported on this platform. DWARF backtrace method will be used.
Generating '/tmp/nsys-report-de63.qdstrm'[1/8] [========================100%] report4.nsys-rep
[2/8] [========================100%] report4.sqlite[3/8] Executing 'nvtxsum' stats report
SKIPPED: /home/en/document/CUDA/report4.sqlite does not contain NV Tools Extension (NVTX) data.[4/8] Executing 'osrtsum' stats report
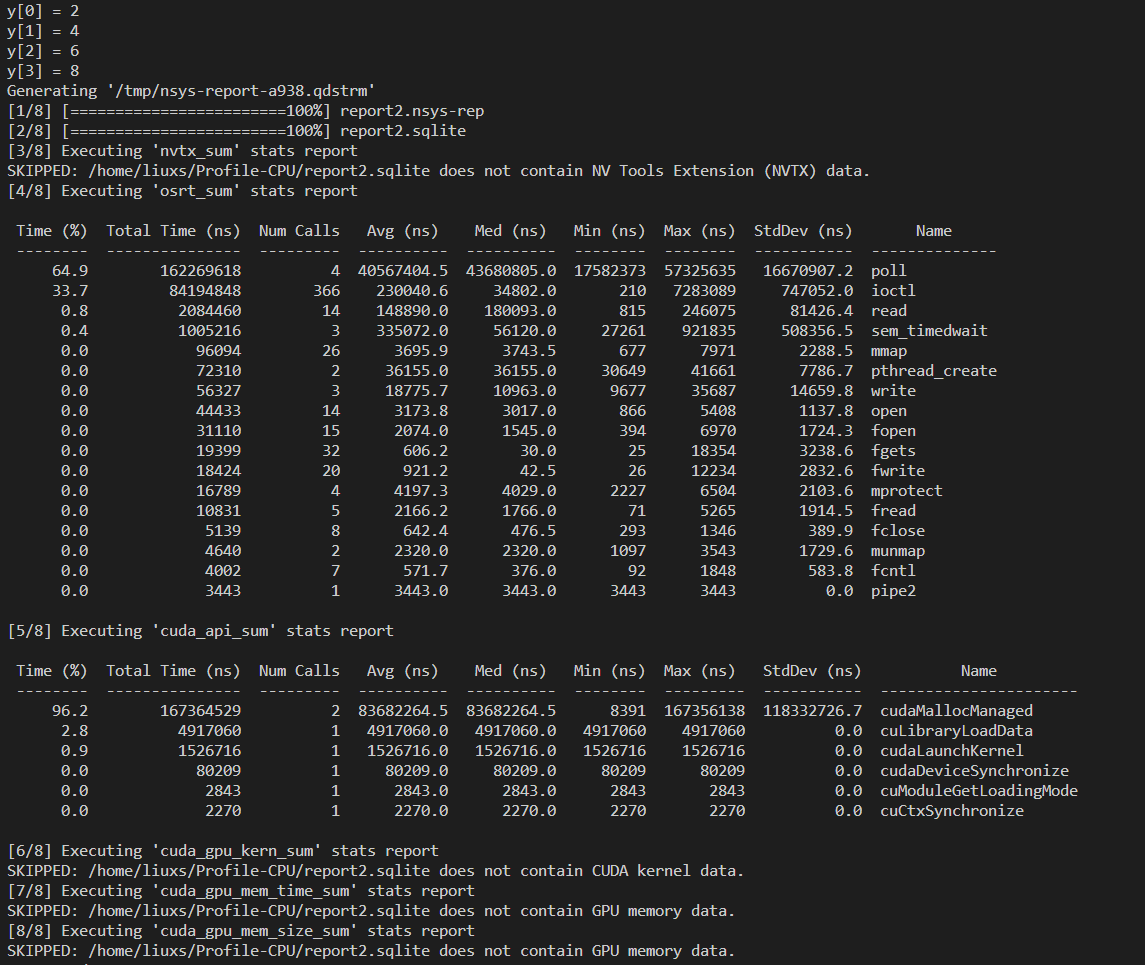
Operating System Runtime API Statistics:
Time (%) Total Time (ns) Num Calls Avg (ns) Med (ns) Min (ns) Max (ns) StdDev (ns) Name
-------- --------------- --------- ---------- ---------- -------- -------- ----------- -------------- 64.6 157648308 4 39412077.0 35653315.5 28684201 57657476 13650714.7 poll
34.8 84933509 222 382583.4 66792.5 1944 13132284 1139266.4 ioctl 0.2 556706 2 278353.0 278353.0 56138 500568 314259.5 sem_timedwait
0.2 492632 4 123158.0 1462.5 1122 488585 243618.1 read 0.1 365409 3 121803.0 49074.0 46078 270257 128573.7 pthread_create
0.0 85845 16 5365.3 4558.5 1243 15229 3517.0 mmap
0.0 42051 7 6007.3 4699.0 2164 13827 4292.3 fopen
0.0 38094 3 12698.0 12274.0 10971 14849 1973.5 write
0.0 29577 1 29577.0 29577.0 29577 29577 0.0 fgets
0.0 15149 3 5049.7 4489.0 2905 7755 2473.1 open
0.0 5460 3 1820.0 1673.0 1563 2224 354.2 munmap
0.0 5310 3 1770.0 1753.0 1573 1984 206.0 fclose
0.0 4097 3 1365.7 1252.0 1162 1683 278.5 fcntl
[5/8] Executing 'cudaapisum' stats report
SKIPPED: /home/en/document/CUDA/report4.sqlite does not contain CUDA trace data.
[6/8] Executing 'gpukernsum' stats report
SKIPPED: /home/en/document/CUDA/report4.sqlite does not contain CUDA kernel data.
[7/8] Executing 'gpumemtimesum' stats report
SKIPPED: /home/en/document/CUDA/report4.sqlite does not contain GPU memory data.
[8/8] Executing 'gpumemsizesum' stats report
SKIPPED: /home/en/document/CUDA/report4.sqlite does not contain GPU memory data.
Generated:
/home/en/document/CUDA/report4.nsys-rep
/home/en/document/CUDA/report4.sqlite
What driver are you using? I am on Driver Version: 530.30.02, CUDA Version: 12.1, NVIDIA Nsight Systems version 2023.1.2.43-32377213v0. My laptop system is ubuntu 22.04 LTS, a windows system running wsl2 won’t work for me. BTW, due to some conflicts, I recently re-installed all CUDA related software.
I am currently using 530.41.03 CUDA version: cuda_12.1.r12.1 and we share the same version of Nsight system on Arch Linux. Seems like we share pretty similar software equipment, so it might be caused by my CUDA program itself. Thanks a lot!
What do I do? Add everything up? The online notebook’s report for the nsys profile command gets me one number for the kernel which is what I want to be comparing across different kernel configurations isn’t it? I also have a similar setup with Windows 11, WSL2, Ubuntu 22.04, Cuda 12.1