After I convert my pth model to onnx to trt, the result shows no speedup, even slower…
Environment
TensorRT Version: 8.4.0 GPU Type: Tesla T4 Nvidia Driver Version: 460.106.00 CUDA Version: 10.2 CUDNN Version: 8.1.1 Operating System + Version: ubuntu 18.04 Python Version (if applicable): TensorFlow Version (if applicable): PyTorch Version (if applicable): Baremetal or Container (if container which image + tag):
Relevant Files
We are in corporate intranet, Sorry that I couldn’t upload any file…
Steps To Reproduce
I convert my pth model to onnx with python and then convert to trt with trtexec. The code covert to trt shows below: ./trtexec --tacticSources=-cublasLt,+cublas --verbose --onnx=./model.onnx --explicitBatch --saveEngine=./model.engine --workspace=1000
But when I test the trt model, it shows no speed up. Then I check the model with trtexec profiling, the code shows below: ./trtexec --loadEngine=./model.engine --batch=1 --dumpProfile --profilingVerbosity=detailed --dumpLayerInfo
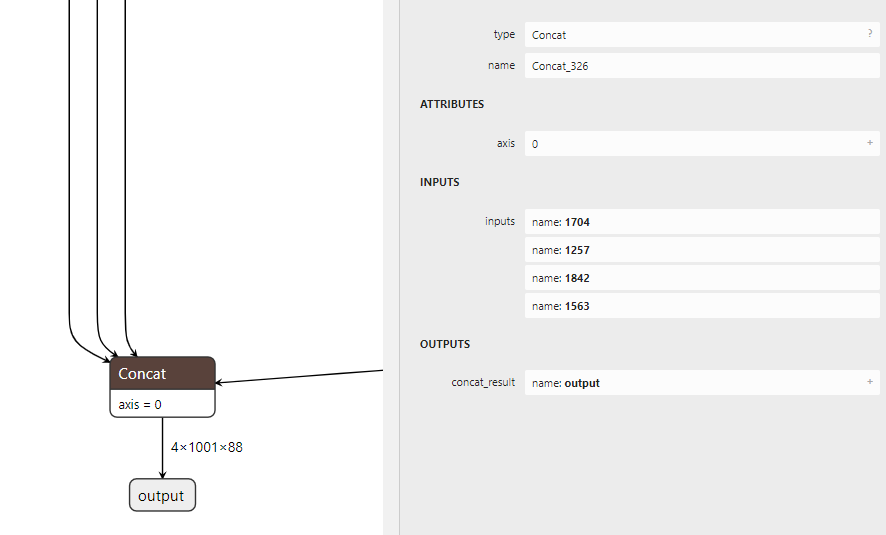
The result shows that there is one node named “{ForeignNode[(Unnamed Layer* 1000) [LoopOutput][length][Constant]…Concat_326]}” cost abuout 85% time at the end of the model. But that node should just do a ‘concat’ operation. Figs showed below:
Hello, thanks for your quick reply.
As I said, I have tried run my model with trtexec command, and the command is:
“./trtexec --loadEngine=./model.engine --batch=1 --dumpProfile --profilingVerbosity=detailed --dumpLayerInfo”
And to my knowledge, this does the simply inference with random input already without data pre and post processing.
As the fig result shows of my question, there’s six “concat” operation and the fifth is the most time-consuming. I wonder if this is because the stream need to synchornize or the data copy from device to host? or some other reasons?
Looks like there is a misunderstanding of the log. You thought that the most time-consuming layer is concat, but in fact, it is a Myelin layer that corresponds to the entire graph.
Without the ONNX model, it would be hard for us to provide any useful suggestions or debug this.
If possible, could you please share with us the minimal issue repro ONNX model in DM?
Hi, thank you for your reply.
I also issued this problem on github and had solved it.
It was a false alarm that the verbose didn’t print all the layers. The most time-consuming layer contained a bunch of layers.
Thanks for your advice again!