What can I do to solve this problem? I have a lot of business running on nvvideoconvert , and need to transfer some of the work pressure from VIC to GPU.
Hello, @DaneLLL
I need a way to make nvvideoconvert work on the gpu.Even if I increase the VIC working frequency, vic’s resources are not enough for my business
Hi,@DaneLLL,
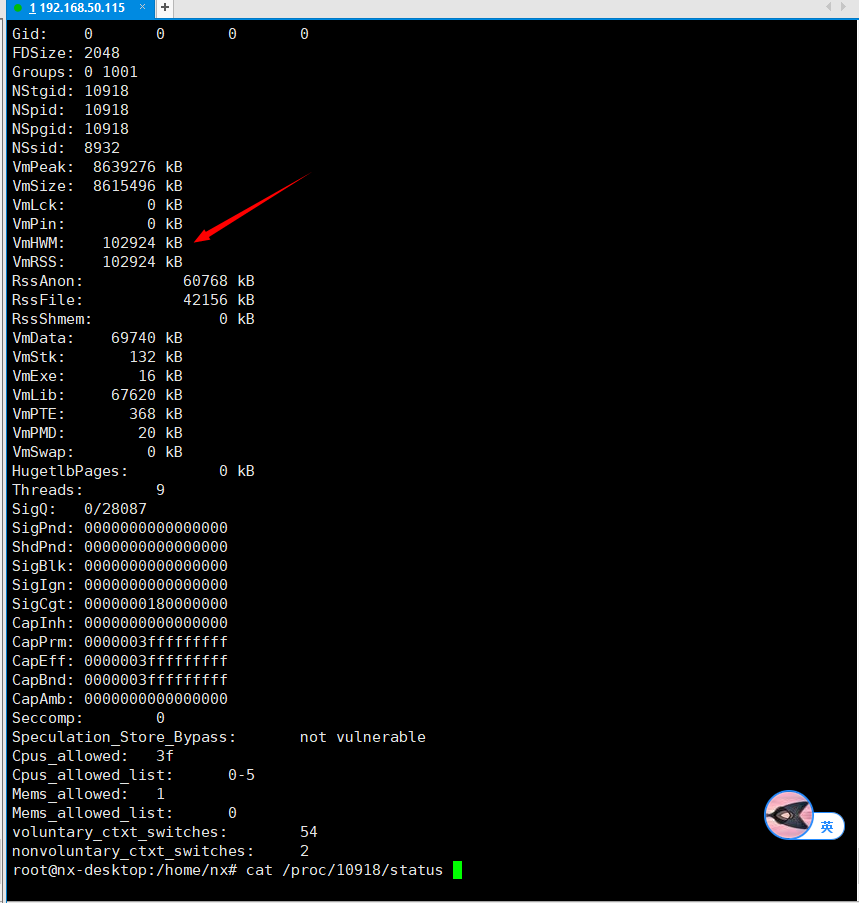
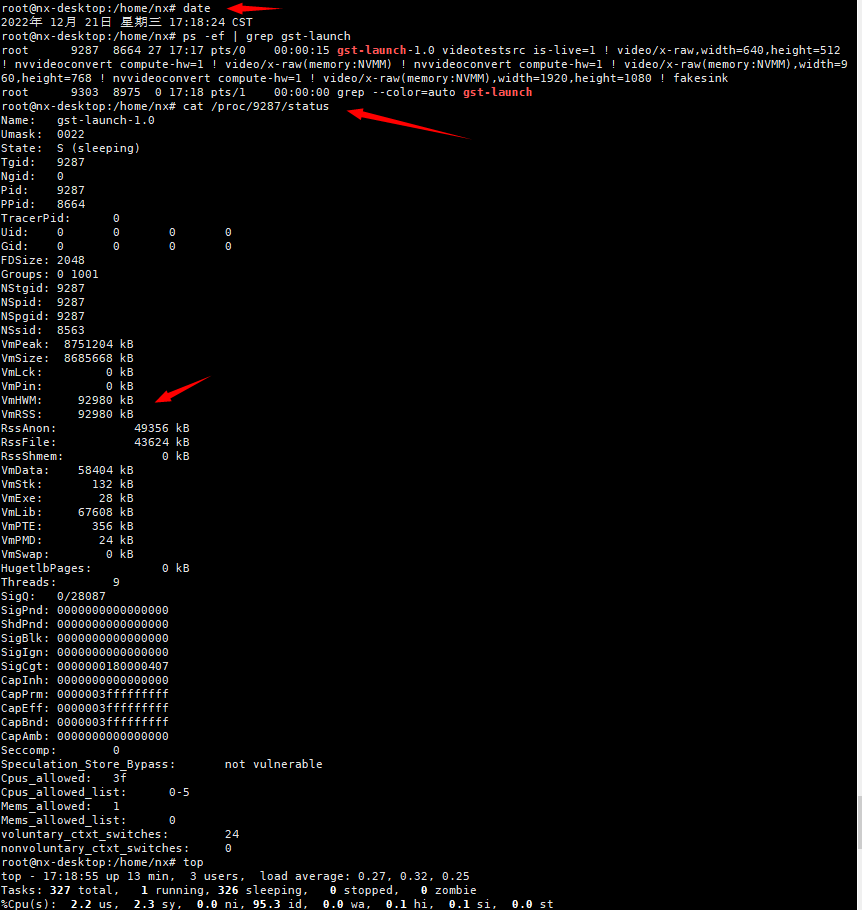
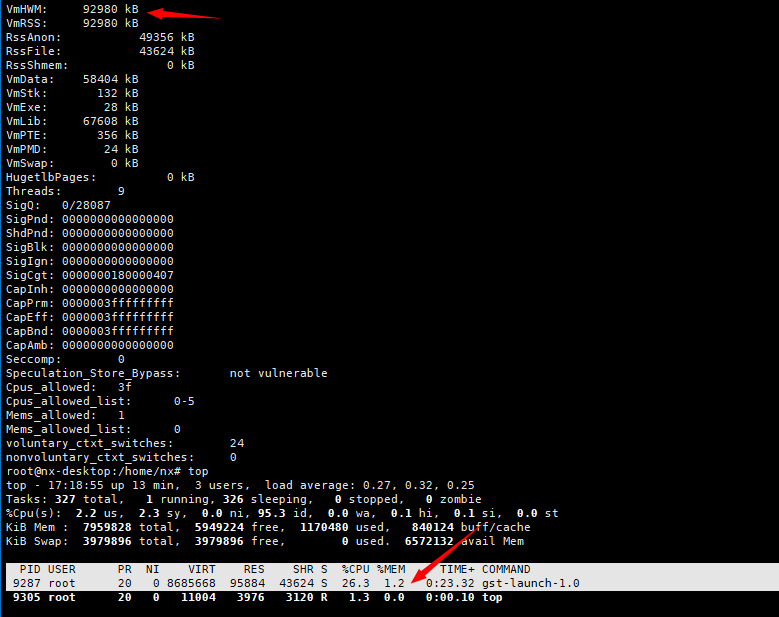
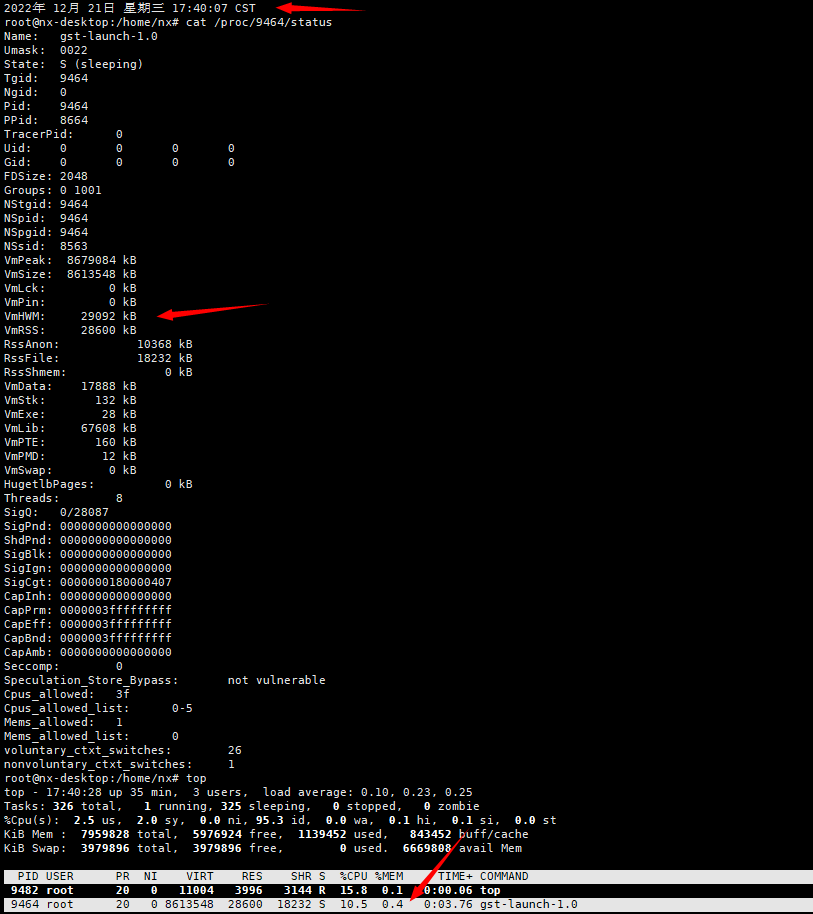
I wrote a simple test program for you.You can use instructions(cat /proc/pid/status) to observe the slow leakage of his physical existence
to convert CPU buffers to NVMM buffers, NVMM buffers to CPU buffers, or NVMM buffers to NVMM buffers. But you run it like:
video/x-raw ! nvvideoconvert ! video/x-raw
For utilizing hardware acceleration we would like to have data in NVMM buffers but somehow you use CPU buffers in you ruse-case. This may not be an optimal solution. Do you observe the issue if using NVMM buffers?
Hi,@DaneLLL
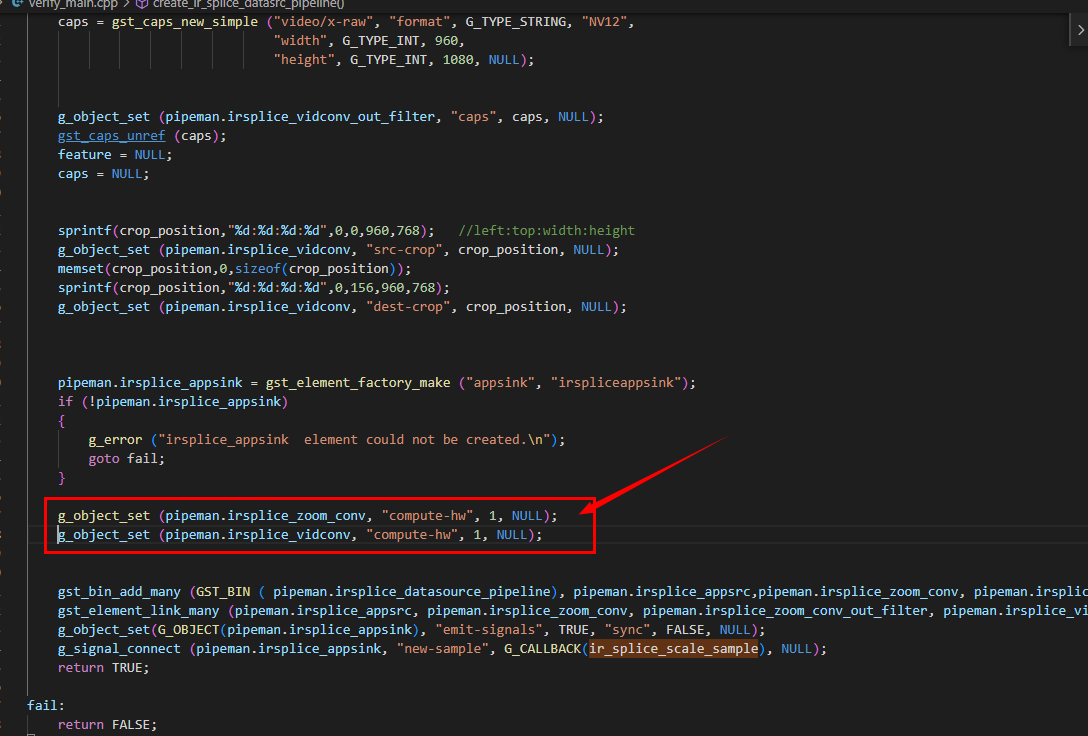
Making nvvideoconvert work on GPU can trigger memory leaks, whether using cpu memory or NVMM.This bug is very easy to repeat,you can refer to the code I set up the nvmm type today.
#!/usr/bin/env python3

import gi
import time
gi.require_version('Gst', '1.0')
from gi.repository import Gst, GObject, GLib

pipeline = None

# initialize GStreamer
Gst.init(None)
pipeline = Gst.parse_launch(
        "videotestsrc is-live=1 ! video/x-raw,width=640,height=512 ! nvvideoconvert compute-hw=1 ! video/x-raw(memory:NVMM) ! nvvideoconvert compute-hw=1 ! video/x-raw(memory:NVMM),width=960,height=768 ! nvvideoconvert compute-hw=1 ! video/x-raw(memory:NVMM),width=1920,height=1080 ! fakesink "
    )

for i in range(1, 2):
    print("loop =",i," ")

    # start playing
    pipeline.set_state(Gst.State.PLAYING)
    pipeline.get_state(Gst.CLOCK_TIME_NONE)

    time.sleep(65536)
    print("Send EoS")
    Gst.Element.send_event(pipeline, Gst.Event.new_eos())
    # wait until EOS or error
    bus = pipeline.get_bus()
    msg = bus.timed_pop_filtered(
        Gst.CLOCK_TIME_NONE, Gst.MessageType.EOS)

    pipeline.set_state(Gst.State.NULL)
    pipeline.get_state(Gst.CLOCK_TIME_NONE)
And execute top to check memory status. Don’t see increase in memory. Do you hit the issue in specific operation? In the pipeline there is upscale and downscale. These operations seem to work fine.
Hi,
We try the gst-launch-1.0 command you shared on Jetpack 4.6.3(r32.7.3) and do not see the memory increase. So it probably is specific to r32.6.1. Do you observe the issue in both running gst-launch-1.0 command and the python sample?
This is a real problem. Our bulk products are deployed in c++, and our application scenarios don’t use python.
I have provided many methods of recurrence, please follow up to solve
The problem can also be reproduced using your python example.
Please observe with the “cat /proc/pid/status” command,If you use “top” it takes a while to see an increase,because it’s not leaking fast enough.
Can you help to determine what has been fixed compared with the latest version? Can you provide
a patches?
We have a batch of hundreds of products already deployed to the customer,we can only upgrade the software, we can’t recall the product and burn a new version.