System Configuration
I have a C++ CUDA application that involves performing lots of FFTs and various arithmetic operations. The application is kicked off on a cluster via SLURM/MPI (not using CUDA-aware MPI). Each node is executing 24 ranks / processes, each GPU is being utilized concurrently by 6 processes - this yields ~60% overall GPU utilization in most cases. Each process is only using ~90MB of GPU memory.
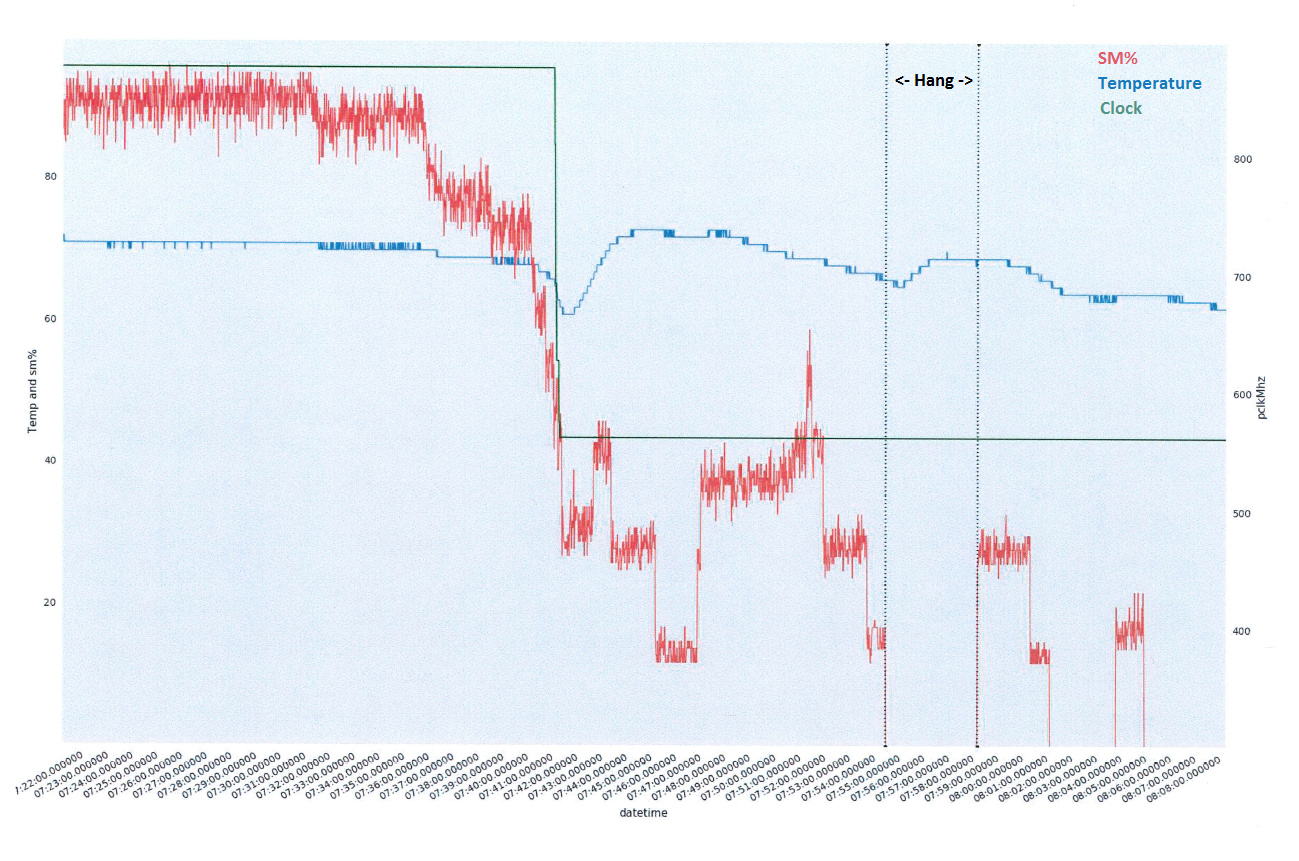
I’m encountering a problem where some processes (usually 1-2 per node) are hanging after 1-2 days of execution. After lots of experiments, it does not seem to be a function of the work they are performing. The jobs can be terminated / restarted, they finish the work they were originally hung on, and continue for another 1-2 days (eventually hanging at the same point, see below).
Below are some data points that lead me to believe there is something suspect in the software / driver stack:
Note: I ran cuda-memcheck, host memory checkers, and nvidia-smi to ensure there aren’t ECC / memory errors.
Below is the stack trace obtained with gdb. The program is clearly hung, as it is not producing any output. I can continue the program and get the same stack trace every time in gdb. Note: I had to manually type in the stack traces, so I omitted the memory addresses and truncated it at the point where the application calls into the CUDA library.
#0 in clock_gettime ()
#1 in clock_gettime() from /usr/lib64/libc.so.6
#2 in ?? () from /usr/lib64/libcuda.so.1
#3 in ?? () from /usr/lib64/libcuda.so.1
#4 in ?? () from /usr/lib64/libcuda.so.1
#5 in ?? () from /usr/lib64/libcuda.so.1
#6 in ?? () from /usr/lib64/libcuda.so.1
#7 in ?? () from /usr/lib64/libcuda.so.1
#8 in ?? () from /usr/lib64/libcuda.so.1
#9 in cuMemcpyDtoH_v2 () from /usr/lib64/libcuda.so.1
#10 in ?? () from /usr/local/cuda-10.0/targets/x86_x64-linux/lib/libcudart.so.10.0
#11 in ?? () from /usr/local/cuda-10.0/targets/x86_x64-linux/lib/libcudart.so.10.0
#12 in cudaMemcpy () from /usr/local/cuda-10.0/targets/x86_x64-linux/lib/libcudart.so.10.0
#13 in cuMemoryWrap::moveToHost () from libMyLibrary.so
...
Below is the stack trace from cuda-gdb:
#0 in cuVDPAUCtxCreate () from /usr/lib64/libcuda.so.1
#1 in cuVDPAUCtxCreate () from /usr/lib64/libcuda.so.1
#2 in cuVDPAUCtxCreate () from /usr/lib64/libcuda.so.1
#3 in cuMemGetAttribute_v2 () from /usr/lib64/libcuda.so.1
#4 in cudbgApiDetach () from /usr/lib64/libcuda.so.1
#5 in cudbgApiDetach () from /usr/lib64/libcuda.so.1
#6 in cuVDPAUCtxCreate () from /usr/lib64/libcuda.so.1
#7 in cuVDPAUCtxCreate () from /usr/lib64/libcuda.so.1
#8 in cuEGLApiInit () from /usr/lib64/libcuda.so.1
#9 in cuEGLApiInit () from /usr/lib64/libcuda.so.1
#10 in cuEGLApiInit () from /usr/lib64/libcuda.so.1
#11 in cuMemGetAttribute_v2 () from /usr/lib64/libcuda.so.1
#12 in cuMemGetAttribute_v2 () from /usr/lib64/libcuda.so.1
#13 in cuMemcpyDtoH_v2 () from /usr/lib64/libcuda.so.1
#14 in __cudaInitModule () from /usr/local/cuda-10.0/targets/x86_x64-linux/lib/libcudart.so.10.0
#15 in cudaGetExportTable () from /usr/local/cuda-10.0/targets/x86_x64-linux/lib/libcudart.so.10.0
#16 in cudaMemcpy () from /usr/local/cuda-10.0/targets/x86_x64-linux/lib/libcudart.so.10.0
#17 in cuMemoryWrap::moveToHost () from libMyLibrary.so
...
Does anyone know why the gdb shows clock_gettime at the top of the stack, while cuda-gdb shows functions within libcuda? Is it that gdb has limited insight at the point where the application is waiting for the driver - presumably in a poll / sleep loop?
We have started down the long trial-and-error road of rolling back the driver, but I’m posting this issue to the forum to see if anyone has encountered similar issues or if they have suggestions on how to overcome this error. Thanks in advance for any help / suggestions!
-adam