[Multiple GPUs / Processes] CUDA Memory De/Allocation Slow

System Specs:

  • Dual Hex Core Intel Xeon CPUs
  • 512GB System Memory
  • Two NVIDIA Tesla K80 GPUs (4 logical devices)
  • CentOS 6.6
  • CUDA 7.5
  • GCC 4.8.2

I’m using slurm to kick off 12 concurrent processes, where each group of 3 processes uses the same GPU (i.e., P0-2: GPU0, P3-5: GPU1, P6-8: GPU2, P9-11 GPU3). I notice a dramatic / order-of-magnitude speed decrease relative to the performance of 3 processes using 1 GPU. In the 12 process case (3 processes per GPU), I observe (using nvidia-smi) all 4 GPUs utilization are <10% – whereas, in the 3 process / 1 GPU case, the utilization is >40%.

I ran the nvprof tool on all 12 processes and observed the kernel execution time is actually the same as the 3 process / 1 GPU case. However, more than 10x time is spent in the CUDA API (i.e., cudaMalloc, cudaFree, cudaHostAlloc, cudaFreeHost, cudaMemcpy).

It is expected that if multiple processes are using the same GPU, the memory operations need to be synchronized. However, in the case where 4 GPUs are being used simultaneously / independently, I wouldn’t expect the operations on one GPU to affect operations on a different GPU, but through timing analysis, there appears to be a dependency.

Does anyone have experience using multiple GPUs in independent processes? Have you encountered this issue? As a work-around, I have implemented a memory pool, as to lessen the pressure on the CUDA API. However, it would be satisfying to understand the root problem / limitations of the CUDA API.

Thanks for your time. As a side note, this forum has been extremely beneficial throughout my CUDA development.

Thanks,
adam

I don’t have hands-on experience with such a massive system, but here are a couple of comments:

(1) It is known that lengthy CUDA context initialization time can occur on system with massive amounts of system memory and many GPUs, due to the need to map all this memory into a single virtual address space for both CPU and GPU. Since a call to cudaMalloc() is often the first CUDA API call in an application, that initialization time could show up as being taken by the cudaMalloc() call. You can separate out the initialization time by first calling cudaFree(0) which triggers CUDA context creation.

(2) cudaHostAlloc() and cudaFreeHost() are thin wrappers around host operating system calls (I think on Linux it is mmap), so any slowness you observe on those should be direcly due to the operating system itself. You can use a OS profiling/tracing tool to find out what’s going on there.

Thanks for your response, njuffa! Below are my follow-up responses:

(1) I read this suggestion (and implemented it) from another post to call cudaFree(0) immediately after selecting the device. I see the initialization / context creation time show up in the “Max” statistic of the nvprof report. This is a one-time penalty that doesn’t explain the overall decrease in speed when I’m running 12 processes that are using the 4 GPUs (3 processes per GPU).

(2) I tried allocating pinned host memory (i.e., not using cudaHostAlloc) as you suggest, but I still see long times in the cudaMalloc, cudaFree, and cudaMemcpy API calls. This leads me to believe some type of locking (across processes / devices!) is occurring.

Thanks again,
adam

Generally speaking, locking tends to be an issue with memory allocation in this kind of environment (even for non-GPU scenarios, which is why projects like Hoard exist). I don’t know any specifics with regard to CUDA though. Maybe txbob or someone else using large systems can shed some light on this.

It might also be helpful to file an RFE (request for enhancement) with NVIDIA to put this issue on the CUDA developer’s radar. Developers are unlikely to routinely work on platforms with half a TB of system memory, which means the severity of the performance degradation may not be fully appreciated. RFEs can be filed using the regular bug reporting channels, simply prefix the synopsis with “RFE” so it is understood that this is an enhancement request rather than a report for a function bug.

Out of personal interest: what is your system platform (if you are allowed to reveal it)? I don’t think I have ever encountered anybody running a dual-socket system with 512 GB of system memory.

  1. Do any of these processes communicate with each other via MPI? Or are they all independent tasks?

  2. What compute mode are the GPUs in?

  3. Are you using managed memory at all?

  4. Is slurm (as part of job preamble) making any modification to the environment (e.g. setting CUDA_VISIBLE_DEVICES, or any other such mods)?

  5. Is there any change in behavior if you launch the processes manually on the node, without involving a job scheduler/resource manager?

  6. Since you appear to be declaring that things are “independent”, is there any change in behavior if each process is executed with the CUDA_VISIBLE_DEVICES environment variable set in such a way that it restricts the visible GPU to the one that the process will actually use?

For example, suppose my executable is my_exe, then processes P0-P2 would launch as:

CUDA_VISIBLE_DEVICES=“0” ./my_exe

processes P3-P5 would launch as:

CUDA_VISIBLE_DEVICES=“1” ./my_exe

and etc.

  1. Not necessarily as a diagnostic, but you may also want to try experimenting with CUDA MPS for possible performance enhancement. The canonical use-case for CUDA MPS is for multiple MPI ranks sharing a GPU, but it can be used even if MPI is not in view, as discussed here:

[url]gpu - How do I use Nvidia Multi-process Service (MPS) to run multiple non-MPI CUDA applications? - Stack Overflow

Thanks for your response, txbob! Below are my respective follow-up responses:

  1. I’m not using MPI, the processes are completely independent tasks.

  2. The GPUs are in the default compute mode

[Ref: http://docs.nvidia.com/cuda/cuda-c-programming-guide/#compute-modes]

Default compute mode: Multiple host threads can use the device (by calling cudaSetDevice() on this device, when using the runtime API, or by making current a context associated to the device, when using the driver API) at the same time.

  1. By “managed memory” are you referring to memory managed by the .NET CLR (e.g., C#)? If so, the answer is no. My program is written in native C++. I’m using the cudaHostAlloc/cudaFreeHost APIs to de/allocate pinned host memory, and new/delete to de/allocate heap memory for non-CUDA tasks.

  2. I checked that slurm is not modifying any CUDA environment variables. In general, slurm doesn’t know the application is using a GPU.

  3. I tried manually launching the processes (i.e., outside of slurm) and it yielded the same results.

  4. I tried using the “CUDA_VISIBLE_DEVICES” environment variable and it yielded the same results.

Note to others reading this post: when setting “CUDA_VISIBLE_DEVICES”, the application only has access to the GPU specified (i.e., it appears there is only one GPU in the system and cudaGetDeviceCount returns 1), so you must always set the device id = 0 when calling cudaSetDevice.

  1. I will work with my system administrator to experiment with CUDA MPS. I’m in a very constrained environment, so this is difficult.

As I mentioned in my original post, I implemented a memory pool to recycle CUDA-allocated buffers. This obviously reduced the number of CUDA API calls, so the overall run-time improved.

In general, there is still a fundamental outstanding question: why is the CUDA API dramatically slow when independent processes are accessing different GPUs simultaneously (i.e., de/allocating and copying memory)? The perception is that the API is locked across all processes/devices. Theoretically, there should be no dependencies from the physical GPU all the way up to the application/process. However, maybe I’m not realizing a limitation in the API, driver, or lower-level component.

Thanks for your time,
adam

By managed memory I was referring to what is described here:

http://docs.nvidia.com/cuda/cuda-c-programming-guide/index.html#um-unified-memory-programming-hd

I don’t think you are using it.

You haven’t actually provided a test case. I created one essentially using the CUDA sample code vectorAdd modified to run in a loop 1000 times.

I was able to reproduce the slower execution time in a multi-process/multi-GPU setting. A single instance of the app took about 2.8 seconds to run (1000 loops). With 4 instances running (each targetting separate GPUs) each instance took about 4 seconds.

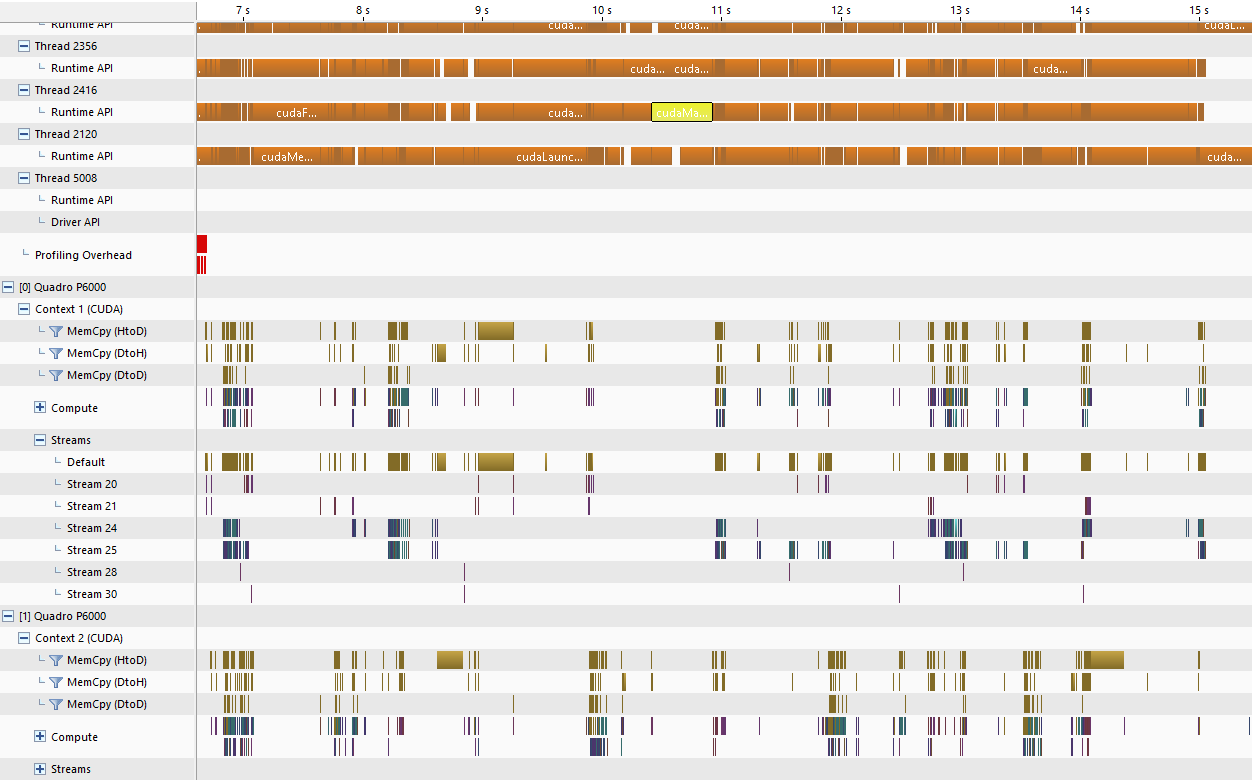
For my test I only ran one instance on each GPU using taskset to select separate CPU cores for each instance, and also to manage CPU/GPU affinity.

According to my observation via nvprof, the cudaMemcpy times were not worse (although I did not test pinned memory, nor did I test multiple processes per GPU). The main differences in runtime API behavior were in cudaMalloc and cudaFree. I haven’t done the necessary arithmetic to prove that these differences account for nearly all of the runtime difference, but eyeballing the data (below) suggests that may be the case, for my test case.

At the moment I cannot explain this so I’ve filed a (performance) bug. I don’t have any further information at this time, and can’t speculate about when it may be looked at or make any forward-looking statements. These statements are not acknowledging a defect, and at this time the bug is simply for tracking purposes. Although I can’t discuss details, it’s entirely possible that the driver/GPU management may dictate some sort of contention in such a scenario, although there presumably is always room for engineered improvement. The GPU driver is a single point of access/single entity for all GPUs in the system, so you can draw your own conjecture.

Here’s an example of my nvprof output. The first file is a single instance of the application, running on CPU socket 0 attached to GPU 0 (K80. CPU is a 16-core haswell CPU (dual socket). OS is CentOS 6.6, CUDA 7.5, driver 352.68). The second file is looking at the same app running on the same GPU and CPU socket, but with 3 other instances of the program running, all 3 on CPU socket 1, talking to 3 other K80 GPUs (this node has 4 K80’s, 8 devices total, one K80 on socket 0, 3 on socket 1):

$ cat t911.nvprof
==17927== NVPROF is profiling process 17927, command: ./t911 1000
==17927== Profiling application: ./t911 1000
==17927== Profiling result:
Time(%)      Time     Calls       Avg       Min       Max  Name
 64.21%  66.303ms      2000  33.151us  29.855us  36.544us  [CUDA memcpy HtoD]
 30.42%  31.410ms      1000  31.409us  29.663us  33.119us  [CUDA memcpy DtoH]
  5.37%  5.5454ms      1000  5.5450us  5.0870us  6.0160us  vectorAdd(float const *, float const *, float*, int)

==17927== API calls:
Time(%)      Time     Calls       Avg       Min       Max  Name
 45.82%  468.49ms      3000  156.16us  3.1140us  235.27ms  cudaMalloc
 34.71%  354.91ms      3000  118.30us  3.4700us  826.99us  cudaFree
 18.00%  184.02ms      3000  61.339us  25.650us  188.76us  cudaMemcpy
  1.17%  12.008ms      1000  12.007us  11.207us  35.353us  cudaLaunch
  0.12%  1.2672ms        83  15.267us      97ns  570.40us  cuDeviceGetAttribute
  0.07%  701.96us      4000     175ns     125ns  2.5060us  cudaSetupArgument
  0.05%  513.99us      1000     513ns     431ns  2.9890us  cudaConfigureCall
  0.02%  247.69us      1000     247ns     185ns  4.2240us  cudaGetLastError
  0.01%  126.40us         1  126.40us  126.40us  126.40us  cuDeviceTotalMem
  0.01%  112.51us         1  112.51us  112.51us  112.51us  cuDeviceGetName
  0.00%  1.8670us         2     933ns     276ns  1.5910us  cuDeviceGetCount
  0.00%     480ns         2     240ns     174ns     306ns  cuDeviceGet
$
$ cat t911_0.nvprof
==18445== NVPROF is profiling process 18445, command: ./t911 1000
==18445== Profiling application: ./t911 1000
==18445== Profiling result:
Time(%)      Time     Calls       Avg       Min       Max  Name
 63.31%  60.864ms      2000  30.432us  29.887us  37.728us  [CUDA memcpy HtoD]
 30.93%  29.735ms      1000  29.734us  29.663us  35.391us  [CUDA memcpy DtoH]
  5.76%  5.5410ms      1000  5.5400us  5.0880us  6.0790us  vectorAdd(float const *, float const *, float*, int)

==18445== API calls:
Time(%)      Time     Calls       Avg       Min       Max  Name
 63.25%  1.26059s      3000  420.20us  3.2020us  898.11ms  cudaMalloc
 26.66%  531.33ms      3000  177.11us  3.4630us  1.2056ms  cudaFree
  9.04%  180.09ms      3000  60.029us  25.181us  174.36us  cudaMemcpy
  0.64%  12.681ms      1000  12.680us  11.110us  35.877us  cudaLaunch
  0.28%  5.6198ms        83  67.708us     101ns  2.5559ms  cuDeviceGetAttribute
  0.04%  783.42us      4000     195ns     122ns  11.902us  cudaSetupArgument
  0.03%  626.19us         1  626.19us  626.19us  626.19us  cuDeviceTotalMem
  0.03%  574.05us         1  574.05us  574.05us  574.05us  cuDeviceGetName
  0.03%  523.34us      1000     523ns     412ns  1.3630us  cudaConfigureCall
  0.01%  279.12us      1000     279ns     201ns     958ns  cudaGetLastError
  0.00%  8.2310us         2  4.1150us     347ns  7.8840us  cuDeviceGetCount
  0.00%     450ns         2     225ns     220ns     230ns  cuDeviceGet
$

It’s evident that the worst offenders are cudaMalloc and cudaFree, and it’s also evident that the cudaMemcpy operations don’t (in my test case) suffer any degradation. Here’s the nvidia-smi output from my node and test script I used:

$ nvidia-smi
Fri Mar 18 18:20:23 2016
+------------------------------------------------------+
| NVIDIA-SMI 352.68     Driver Version: 352.68         |
|-------------------------------+----------------------+----------------------+
| GPU  Name        Persistence-M| Bus-Id        Disp.A | Volatile Uncorr. ECC |
| Fan  Temp  Perf  Pwr:Usage/Cap|         Memory-Usage | GPU-Util  Compute M. |
|===============================+======================+======================|
|   0  Tesla K80           On   | 0000:04:00.0     Off |                    0 |
| N/A   33C    P8    28W / 175W |     23MiB / 11519MiB |      0%      Default |
+-------------------------------+----------------------+----------------------+
|   1  Tesla K80           On   | 0000:05:00.0     Off |                    0 |
| N/A   29C    P8    43W / 175W |     23MiB / 11519MiB |      0%      Default |
+-------------------------------+----------------------+----------------------+
|   2  Tesla K80           On   | 0000:84:00.0     Off |                    0 |
| N/A   37C    P8    28W / 175W |     23MiB / 11519MiB |      0%      Default |
+-------------------------------+----------------------+----------------------+
|   3  Tesla K80           On   | 0000:85:00.0     Off |                    0 |
| N/A   31C    P8    42W / 175W |     23MiB / 11519MiB |      0%      Default |
+-------------------------------+----------------------+----------------------+
|   4  Tesla K80           On   | 0000:8A:00.0     Off |                    0 |
| N/A   29C    P8    28W / 175W |     23MiB / 11519MiB |      0%      Default |
+-------------------------------+----------------------+----------------------+
|   5  Tesla K80           On   | 0000:8B:00.0     Off |                    0 |
| N/A   35C    P8    40W / 175W |     23MiB / 11519MiB |      0%      Default |
+-------------------------------+----------------------+----------------------+
|   6  Tesla K80           On   | 0000:8E:00.0     Off |                    0 |
| N/A   30C    P8    28W / 175W |     23MiB / 11519MiB |      0%      Default |
+-------------------------------+----------------------+----------------------+
|   7  Tesla K80           On   | 0000:8F:00.0     Off |                    0 |
| N/A   41C    P8    41W / 175W |     23MiB / 11519MiB |      0%      Default |
+-------------------------------+----------------------+----------------------+
$ cat t911.run
#!/bin/bash
CUDA_VISIBLE_DEVICES="0" taskset -c 0  nvprof --log-file t911_%q{CUDA_VISIBLE_DEVICES}.nvprof ./t911 1000 &
CUDA_VISIBLE_DEVICES="2" taskset -c 16 nvprof --log-file t911_%q{CUDA_VISIBLE_DEVICES}.nvprof ./t911 1000 &
CUDA_VISIBLE_DEVICES="4" taskset -c 17 nvprof --log-file t911_%q{CUDA_VISIBLE_DEVICES}.nvprof ./t911 1000 &
CUDA_VISIBLE_DEVICES="6" taskset -c 18 nvprof --log-file t911_%q{CUDA_VISIBLE_DEVICES}.nvprof ./t911 1000 &

Your intuition about a workaround seems valid to me. In general, even apart from this issue, we want to avoid, as much as possible, cudaMalloc and cudaFree in performance-sensitive areas of the code. Ideally, do the minimum number of cudaMalloc operations once, at the beginning of your code. Reusing allocations is beneficial in this regard. Reusing pinned allocations is especially recommended, as the pinning process approximately doubles the allocation time cost.

Thanks for the great response, txbob!

Thanks for formalizing the test case and including the nvprof logs. That is exactly the issue I’m experiencing.

I’m very interested in the results / response from NVIDIA regarding the performance bug you filed.

Try to cache the cudaMalloc/cudaFree, FYI https://github.com/kaldi-asr/kaldi/blob/master/src/cudamatrix/cu-allocator.h

my Test results:
GPU server Motherboards like X10DRG-OT+-CPU | Motherboards | Products | Super Micro Computer, Inc., when run more than one GPU jobs, the time of cudaMalloc and cudaFree very job become much longer than one job.
But on common PC, run multi GPU job, the time keep stable.

+1

My code works very slow on two Quadro P6000 (two-socket server, Windows), in profiler allocations were taking up to 600 ms (see screenshot).

But on the same computer under Linux everything seems to works fine. Also on another Windows two-socket (much older one) and on my single-socket Windows computers: two GPUs provide linear speedup.

Workaround that helped me: do not reallocate memory for each processing part, but reuse buffers from previous part and reallocate (with 10% margin) only if new processing part requires bigger buffers. (this is quite dirty workaround, but it works)

I am not sure why you consider this a “dirty workaround”. As far as I am aware, buffer re-use has been a best practice for working with dynamically allocated memory efficiently since time immemorial. Well, at least since the early 1980s when I first encountered it :-)

Have you checked whether carefully controlling memory and process affinity / bindings on the dual-socket Windows system gets rid of the undesirable overhead? Since the problem occurs only on one of your three Windows machines, it seems like it could be a Windows-specific, NUMA-related issue. I forget whether Windows offers an equivalent to Linux’s numactl.

Because old code was very carefull at memory usage: when new processing part was given (image) - it was possible to estimate exact memory consumption and choose maximum size of processing sub-image tile that can fit into GPU memory. The bigger tile - the better GPU-utilization. So everything was fine, and I was sure about not to encounter out of memory.

But now I must estimate memory consumtion with respect to old buffers - they also consume memory, but they will be reused. And so code become more complicated and more error-prone. And I can’t sleep calmly with confidence now :(

Moreover - I believe that in 2017 I should just code my algorithm, but not to implement allocators :) In 1980s it was ok to take system-wide lock on each allocation, but now there are slightly more than one core. (but this is not important for Microsoft, their malloc also doesn’t scale with NUMA, but even it does not reach 600 ms impressive results)

Also I use each GPU in two threads - for maximum GPU utilization and to hide CPU processing. So the problem of “how much memory can I use” is even more actual. (but in my case I can solve it easily - by limiting memory usage of both threads with half of GPU memory).

Really, look at these profiling results! This is 2017 and NUMA multi-socket systems are commons. And many users still use Windows :) Why allocation takes 600 ms because of just two GPUs and NUMA-windows? I have 23 Gb out of 24 Gb VRAM free, and want to allocate 100 Mb buffer - and it takes 600 ms? Why I should take care of memory management? I think that CUDA driver just takes (very) lot of locks, that are whole driver-wide, but not device-wide, or something similar.

No, I didn’t check affinity and so on - this problem already destroyed a lot of time :( And even if it helps - users are not be able to do this with our product.

And yes, there are no numactl on Windows. For example I found very frustrating that I can do “numactl --interleave=all”-equivalent on Windows only via BIOS.

The harsh truth, as I see it, is that you don’t want to use Windows if you care for robust performance in your HPC applications. Use a professional-grade variant of Linux.

As for application-specific allocators, they are used all the time in performance-sensitive software, even today, from what I have seen of software projects. I don’t know how many different allocation sizes you have to deal with, but consider a memory pool. They are common in performance-sensitive embedded applications.

I do not know the implementation details of CUDA’s allocators. From system level traces it seems they heavily rely on existing operating system facilities for their work. Now, we could speculate whether the slowness is due to these OS facilities, or the way CUDA is using them.

As one can see from these forums, NVIDIA has been aware of the allocator speed issues since the early days of CUDA, and over the years has put some effort into improving performance. The fact that issues persist would tend to point to performance issues in underlying OS functionality, unless one assumes gross incompetence of the part of NVIDIA engineering.

You should feel free to file a request for enhancement (RFE) with NVIDIA, attaching code that reproduces the performance issues. In an ideal case, it could be used as regression test. Filing bugs and RFEs is a formalized way for customers to influence the development process of CUDA. Engineering managers can charge engineering time against the resolution of bugs and RFEs, they cannot charge engineering time against forum comments.

WDDM imposes some additional GPU memory allocation interface layers. Are the GPUs here in WDDM or TCC mode?

If they are not in TCC mode, can you switch them to TCC mode and re-run your test?

Yes, I use Linux, but many users use our software under Windows and Mac.

Yes, I agree, of course this is the multiplication of OS problems and driver relience on some sort of locks/something else.

This is the sad part. I came to forum and started to log my problems here because:

  1. Bug tracker is closed, so you cannot read about workarounds and already reported bugs
  2. Bug tracker is awful, I reported one VERY simple bug with small repro case and it was the most terrible expirience of my bug reporting/contributing. Even the way of attaching files (more precisely - absence) is the very hard way (you should send email, fight with email filtering and so on).
  3. Responses are terribly slow and I have feeling that part of my previous messages are ignored
  4. My single easy-to-fix bug report is still open without response and even without status “yes, your repro is ok, thanks, we will take care when we will have time”
  5. By reporting here I at least know that people who will encounter the same problems will know that they are not alone, and they will read here about workarounds
  6. Example: https://devtalk.nvidia.com/default/topic/527933/cuda-programming-and-performance/memory-leak-problem-in-nvidia-driver/post/3732421/#3732421 - bug was reported with no results, current status of bug is unknown and the problem seems to persist

If the company wants really great bug-reporting mechanism - they do like JetBrains: https://youtrack.jetbrains.com/issues/IDEA

If the company wants cheap, but good-enough bug tracker - they use ready trackers like redmine. Without spending much human-hours you will have at least file attaching out of the box.

Thanks, I will try it in a few days and report the result!

When using GPUs that are used for compute tasks and that support TCC, it is definitely recommended to always use TCC and never WDDM. The general efficiency of the TCC driver is similar to what can be achieved on Linux.

Thanks! It helped:

As I already said: I am using two Quadro P6000, so one of them is used for displaying (and so it can’t be switched from WDDM to TCC), but another one was switched to TCC. And the one with TCC driver now do allocations fast. Thanks!

But this is still weird behaviour. I mean - if user have two-slots GPU server with Windows and two high-end GPUs - he will suddenly find that he cannot use one of his Quadro?

I found this post: [url]https://devtalk.nvidia.com/default/topic/963440/cudamalloc-pitch-_significantly_-slower-on-windows-with-geforce-drivers-gt-350-12/[/url] So this is a common problem.

Is this WDDM driver behaviour investigated in NVIDIA? And if the problem really can’t be fixed/workarounded in driver due to WDDM 2.0 model - is it reported to Microsoft? Because for final consumer this is bug in NVIDIA driver.

You can still use both. If you can tolerate the loss of display on one of them (e.g. because you are dedicating it for compute purposes) then you may find TCC mode preferable. Whether in WDDM + TCC or WDDM + WDDM, both Quadros are still usable - with various caveats.

NVIDIA is aware of various behavioral differences between WDDM and TCC mode. So are many folks outside of NVIDIA:

http://http.developer.nvidia.com/ParallelNsight/2.1/Documentation/UserGuide/HTML/Content/Tesla_Compute_Cluster.htm

http://www.nvidia.com/object/software-for-tesla-products.html

I’m not able to summon up references for documentation of every nuance of behavioral difference between WDDM and TCC mode. And changes occur over time (e.g. from WDDM 1.1 to WDDM 2.0). But the WDDM driver model is maintained and controlled by Microsoft. The NVIDIA GPU CUDA driver must, rather than interacting directly with the GPU (e.g. to perform allocations) interact with the WDDM driver interface. This imposes a range of behavioral differences, some of which are more or less evident.

The TCC driver model was created to address these limitations. Unfortunately its not possible to give all the benefits of the TCC driver model within the WDDM driver model. If that were the case, there would have been no motivation to create the TCC driver model.

Feel free to file a bug at developer.nvidia.com

The best way to think about the situation, IMHO, is this: The WDDM driver model was designed with the needs of Microsoft in mind, primarily abstracting hardware (including memory) as much as possible and giving the OS maximum protection from any nonsense that may be going in graphics drivers. I seem to recall that I read rumors somewhere in the past (in the time of Windows XP) that graphics driver issues were the #1 reason for automated crash reports being sent to Microsoft. If true, it would seem natural that it is in Microsoft’s economic interest to cut down on these issues.

My understanding is that the WDDM design fundamentally imposes performance penalties as a trade-off with the goals of abstraction and robustness. NVIDIA (and presumably others) have been trying to workaround and mitigate these performance issues as best they can, for many years. It is therefore unlikely that someone will find a new silver bullet that will magically fix the performance issues.

I don’t see that Microsoft has any economic incentive to change the design goals of their default driver model, especially as there is an alternative in the form of TCC (which is technically a driver for a “3D-controller” best I recall: something that does not drive the GUI and therefore represents a lower risk from the OS perspective).