Hi Forum!
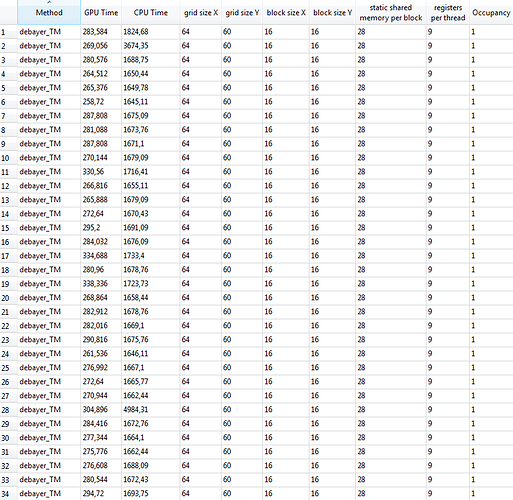
I used the CUDA-profiler to take a closer look at the kernel runtime. I discovered considerable fluctuations. What are the reasons for runtime differences about 80 msec. (340-260=80) in GPU time? Please take a look at the enclosed screenshot "
". Till now I couldn’t find an answere to the high CPU times, too. Why does a calculation of 270 msec. at GPU takes over 1662 msec. at CPU time (e.g. line 27)? That’s about 6 times slower!?!. Also please take a look at line 28: here the GPU time takes 304 msec. and the CPU time takes very long 4984 msec. That’s about 16 times slower CPU-runtime than the actual GPU-runtime. Is this in consequence of the slow latency of memory chips on the videocard? How can I minimize the difference between GPU kernel execution time and the elapsed CPU time?
Maybe that’s the same reason for the long GPU idle time between the upload to device an the kernel execution (please take a look at the enclosed screenshot "

"). How can I minimize this gap? Should (or better: could) I make use of streams or asynchron memcopys? As far as I understand that will only reduce the gap between upload and kernel execution, but how can I bring my CPU-kernel runtime near to GPU-kernel runtime? I missing the forest through the trees. - May I please asked you for some helping answeres? Enclosed you find my entire code.
Thanks for your help.
Sandra
texture<unsigned char, 2, cudaReadModeElementType> imgTex;

__global__ void debayer_TM( uchar3 *res, int width, int height )

{

	unsigned int x = blockIdx.x*blockDim.x + threadIdx.x;

	unsigned int y = blockIdx.y*blockDim.y + threadIdx.y;

	uchar3 c;

	if ( x > 1 && y > 1 && x <= width && y <= height )

	{

		if ( (x&1)==0 )

		{

			if ( (y&1)==0 )

			{

				c.x = tex2D(imgTex, x-1, y-1); //blue

				c.y = tex2D(imgTex, x-1, y  ); //green

				c.z = tex2D(imgTex, x  , y  ); //red

			}

			else

			{

				c.x = tex2D(imgTex, x-1, y  ); //blue

				c.y = tex2D(imgTex, x  , y  ); //green

				c.z = tex2D(imgTex, x  , y-1); //red

			}

		}

		else

			if ( (y&1)==0 )

			{

				c.x = tex2D(imgTex, x  , y-1); //blue

				c.y = tex2D(imgTex, x  , y  ); //green

				c.z = tex2D(imgTex, x-1, y  ); //red

			}

			else

			{

				c.x = tex2D(imgTex, x  , y  ); //blue

				c.y = tex2D(imgTex, x-1, y  ); //green

				c.z = tex2D(imgTex, x-1, y-1); //red

			}

	}

	// write result

	res[y*width + x] = c;

}

extern "C" { void CudaDeBayerTM( IplImage *iplIn, IplImage *iplOut )

{

	//declare device pointer

	uchar3 *DEVres;

	cudaArray *imgArray;

	// create channel descriptor for 2D cuda array

	cudaChannelFormatDesc channelDesc = cudaCreateChannelDesc<unsigned char>();

	//malloc device memory

	int size = sizeof(unsigned char)*iplIn->width*iplIn->height;

	cudaMallocArray(&imgArray, &channelDesc, iplIn->width, iplIn->height);

	cudaMalloc((void**)&DEVres, sizeof(uchar3)*iplIn->width*iplIn->height);

	//copy host2device

	cudaMemcpy2DToArray(imgArray, 0, 0, (unsigned char*) iplIn->imageData, sizeof(unsigned char) * iplIn->widthStep, sizeof(unsigned char) * iplIn->width, iplIn->height, cudaMemcpyHostToDevice);

	// bind the array to the texture

	cudaBindTextureToArray(imgTex, imgArray, channelDesc);


	//launch kernel

	dim3 block(16, 16);

	dim3 grid(iplIn->width/block.x, iplIn->height/block.y);

	debayer_TM <<< grid,block >>> ( DEVres, iplIn->width, iplIn->height );

	CUDA_SAFE_CALL(cudaThreadSynchronize());


	//copy device2host

	cudaMemcpy(iplOut->imageData, DEVres, sizeof(uchar3)*iplIn->height*iplIn->width, cudaMemcpyDeviceToHost);

	//unsigned char *imgChar = (unsigned char*) &iplIn->imageData[0];

	//free memory on device and host

	cudaFreeArray(imgArray);

	cudaUnbindTexture(imgTex);

	cudaFree(DEVres);

}
