When profiling the trtexec with Nsight System tool, I cannot obtain the same results as shown in the tutorial despite launching the same commands. I can only access the DLA’s submissions, but not its effective activities.
My configuration :
Platform : Orin AGX Dev. kit
JetPack : 5.0.2
TensorRT : 8.4.0.1
CUDA : 11.4
Nsight system : 2022.3.3.18-4d5367b
The report obtained in the tutorial (where we see the NvMediaDlaSubmit activity) :
Here is the summary diagnostic collected from Nsight : only 2 NvMedia events were collected.
Information Daemon -00:00.012
Camrtc log-level has been changed from ‘0’ to ‘2’ in order to collect nvmedia events
Profiling has started.
Process was launched by the profiler, see /tmp/nvidia/nsight_systems/quadd_session_101848900/streams/pid_1849083_stdout.log and stderr.log for program output
Common injection library initialized successfully.
NvMedia injection initialized successfully.
NVTX injection initialized successfully.
cuBLAS symbols found in /usr/local/cuda/targets/aarch64-linux/lib/libcublas.so.11 symbol table. No cuBLAS trace will be generated from that library. Was cuBLAS statically linked?
cuDNN injection initialized successfully.
Buffers holding CUDA trace data will be flushed on CudaProfilerStop() call.
Number of other accelerators events collected: 2 019.
CUDA injection initialized successfully.
Number of NVTX events collected: 1 289.
Number of CUDA events collected: 3 555.
No cuDNN events collected. Does the process use cuDNN?
Number of NvMedia events collected: 2.
Number of CUPTI events produced: 4 480, CUPTI buffers: 20.
The cudaProfilerStart API was ignored 1 times due to configuration settings; Note that, when requested, only the first pair of cudaProfilerStart/Stop APIs, after the collection is started, will be effective.
The cudaProfilerStop API was ignored 1 times due to configuration settings; Note that, when requested, only the first pair of cudaProfilerStart/Stop APIs, after the collection is started, will be effective.
Camrtc log-level has been restored to ‘0’
Finally, I have also tried detecting any OOM as suggested in this topic, but without success.
Information Daemon -00:00.000
Camrtc log-level has been changed from ‘0’ to ‘2’ in order to collect nvmedia events
Profiling has started.
Process was launched by the profiler, see /tmp/nvidia/nsight_systems/quadd_session_101867829/streams/pid_1868012_stdout.log and stderr.log for program output
Common injection library initialized successfully.
NvMedia injection initialized successfully.
NVTX injection initialized successfully.
cuBLAS symbols found in /usr/local/cuda/targets/aarch64-linux/lib/libcublas.so.11 symbol table. No cuBLAS trace will be generated from that library. Was cuBLAS statically linked?
cuDNN injection initialized successfully.
Buffers holding CUDA trace data will be flushed on CudaProfilerStop() call.
Number of other accelerators events collected: 1 678.
CUDA injection initialized successfully.
Number of NVTX events collected: 1 256.
Number of CUDA events collected: 19 861.
Number of cuDNN events collected: 128.
Number of NvMedia events collected: 2.
cuBLAS symbols found in /usr/local/cuda/targets/aarch64-linux/lib/libcublas.so.11 symbol table. No cuBLAS trace will be generated from that library. Was cuBLAS statically linked?
Number of CUPTI events produced: 20 459, CUPTI buffers: 20.
The cudaProfilerStart API was ignored 1 times due to configuration settings; Note that, when requested, only the first pair of cudaProfilerStart/Stop APIs, after the collection is started, will be effective.
The cudaProfilerStop API was ignored 1 times due to configuration settings; Note that, when requested, only the first pair of cudaProfilerStart/Stop APIs, after the collection is started, will be effective.
Profiling has stopped.
Camrtc log-level has been restored to ‘0’
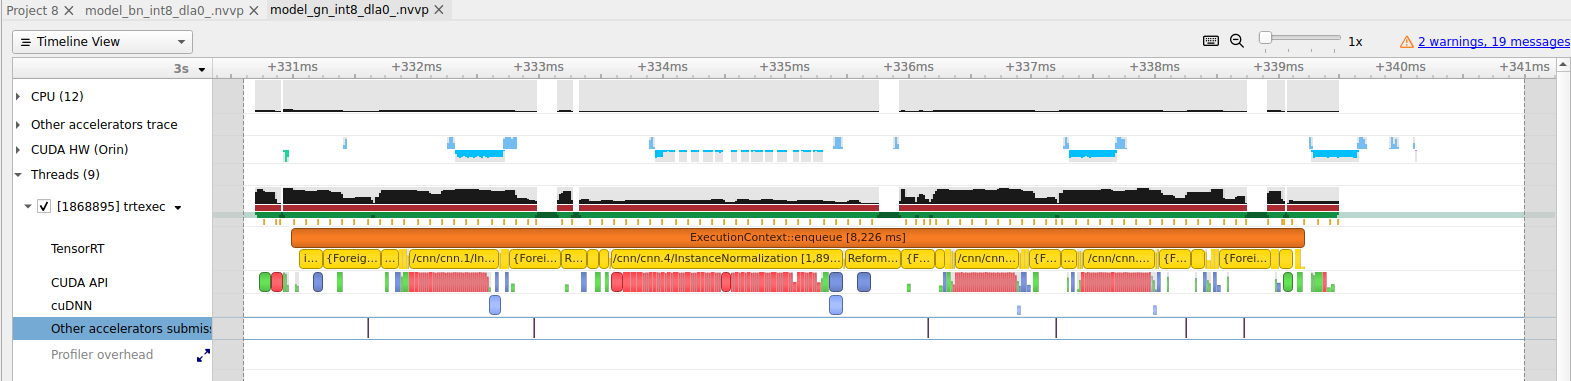
I have found the DLA accelerator trace for one inference (long purple task on the 3rd line) in a subsection different from the trtexec thread. Still, it seems to contradict the other accelerator submission shown in trtexec thread (tiny purple tasks submit on the last line). Once again, the results I got are different from the tutorial ones.