When we compile our project to run a segmentation network on GPU all of our profiling frames show up in nsight systems remote profiler. But when we compile it to run the net on the DLA, not only do the NVTX frames stop showing up, it seems all of the GPU data and much of the CUDA traces are lost as well.
The whole point of moving our segmentation to the dla was to see if we could reduce the load on the GPU but we can’t actually measure that. Is there any way to get nsight systems to work correctly here?
Hi,
Could you check if TensorRT works when putting the model into DLA first?
Since not all the operations in TensorRT are supported by the DLA, you might need to enable allowGPUFallback to enable the pipeline for certain model.
If above works well on your environment, could you share a photo of your Nsight system with us?
Suppose you should be able to see the DLA status at attached picture.
Please also noticed that Nsight System only output the DLA status (idle or busy) rather than utilization.
Thanks.
Yes, the network fully runs on the DLA. See my other thread for that whole process.
The other thing I forgot to mention is that when I run the program under nvprof, all of the ranges are observed as expected. It’s only when I run nsight systems remotely that things don’t work right.
At the moment, we’re not so concerned with profiling the DLA performance. We just want to verify that the GPU is idle while the network is running on DLA in hopes of pipelining the process.
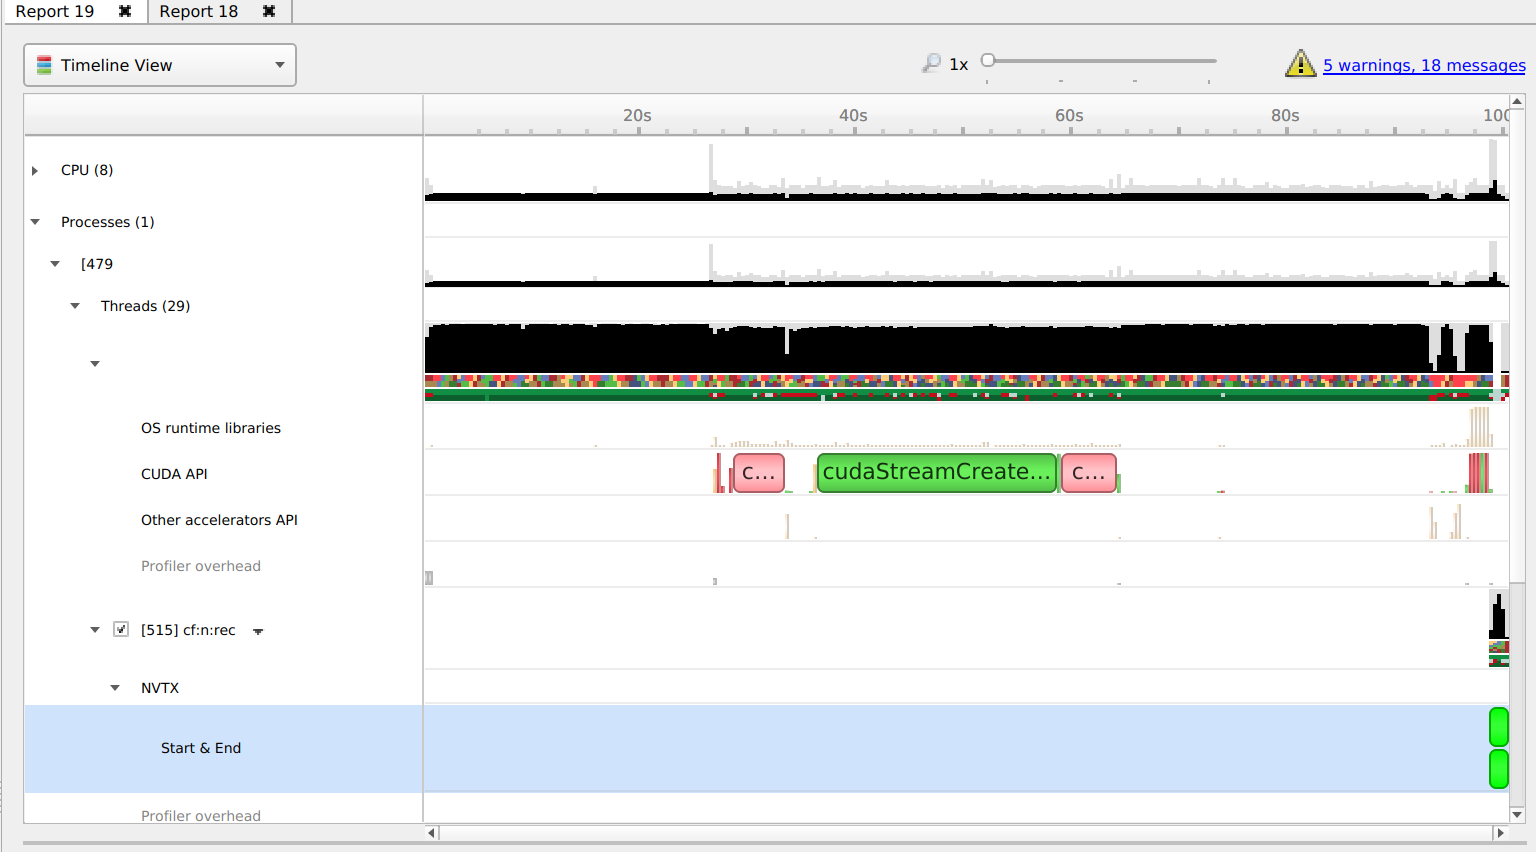
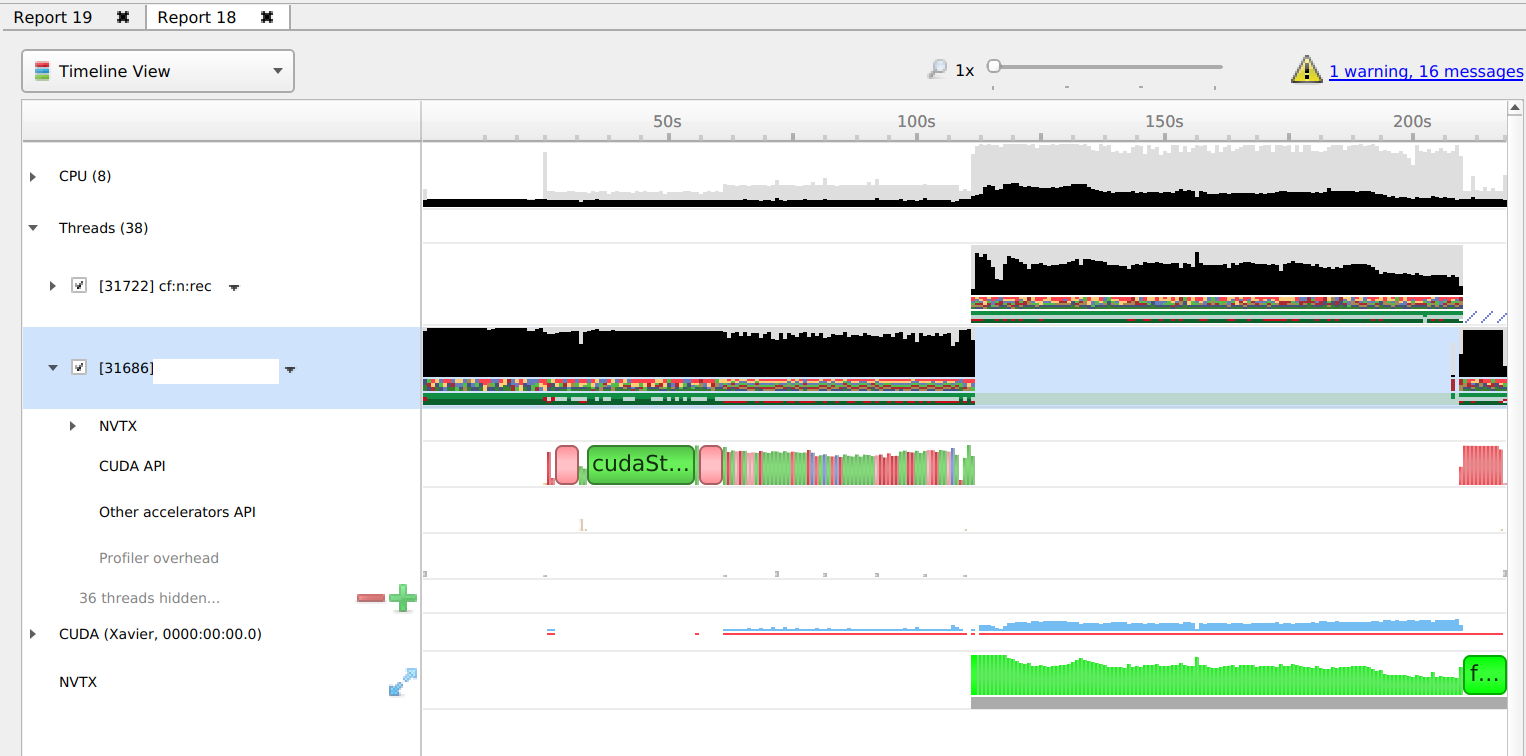
The reports have a completely different structure. When running on GPU it has CPU, Threads, CUDA, and NVTX at the top level. When running on DLA it has CPU, Processes, and iGPU at the toplevel. NVTX only shows up under the Process->process name.
And when running on the DLA the diagnostics summary has warnings about “Not all NVTX/CUDA events might have been collected” that don’t appear when running on GPU.
Actually, looking again, it seems the run on DLA stops after 100s whereas the GPU version stops at 200s. It like the profiler stops gathering events as soon as the DLA starts running? Or maybe running it under the profiler is causing the process to abort early?
Is it possible to get DLA information from nvprof (which is working for us)? or is that only available in nsight (which isn’t)?
Hi,
For checking the GPU status, it’s recommended to use tegrastats instead.
sudo tegrastats
Is this sufficient for you?
Thanks.
I’m trying to get detailed profiling information on the DLA, not general GPU stats
Hi,
We don’t support detail DLA profiling data at this time.
The only information is just active or idle. Is this sufficient for you?
If yes, you don’t need a profiler for this information.
You can check the device node directly:
cat /sys/devices/platform/host1x/15880000.nvdla0/power/runtime_status   #DLA0
cat /sys/devices/platform/host1x/158c0000.nvdla1/power/runtime_status   #DLA1
Ex.
nvidia@jetson-0330618100118:~$ cat /sys/devices/platform/host1x/158c0000.nvdla1/power/runtime_status
active
nvidia@jetson-0330618100118:~$ cat /sys/devices/platform/host1x/158c0000.nvdla1/power/runtime_status
suspended
Thanks.
I don’t understand this response given my first two messages. Nsight systems completely stops gathering profiling data as soon as anything starts running on the DLA. Even if we don’t get detailed profiling data for the actual work going on in the DLA, we should at least be able to get profiling data that has gaps during the operation of the DLA. And the “Other accelerators” profiling in Nsight does show the DLA.
Hi,
Sorry that I thought you are finding other workaround to get DLA status without Nsight System.
The suggestion in comment#7 try to grep device node information directly to get the DLA status.
Another thing we suspect is the memory amount.
When running DL usecase, it usually occupies lots of device memory, especially for a segmentation network.
Is it possible that the device is running out of memory when the inference time, which cause the system stall?
Could you check this by monitoring with tegrastats?
sudo tegrastats
Thanks.
I think you may be right about the memory amount. When running under nvprof with our custom scripts (not using Nsight remote), the system is using all of RAM and almost 8GB of swap space.
Is there any way to verify that it’s exiting due to OOM? I don’t see anything obvious in any of the stdout or error logs.
Hi,
You can monitor the system status with tegrastats.
sudo tegrastats
Thanks.