Gpu not work

We have a module of AGX Orin (32) in our hands, and after running business for a period of time, the GPU cannot work properly. We are using JetPack 5.1.2. The relevant phenomena are as follows:

  1. Call CUDA library。test.cu
#include <stdio.h>
#include <cuda_runtime.h>

int main()
{
    int count;
    cudaGetDeviceCount(&count);
    printf("count = %d\n",count);
    return 0;
}

nvcc test.cu
./test.out
image
2、 View/dev/nvgpu node


image
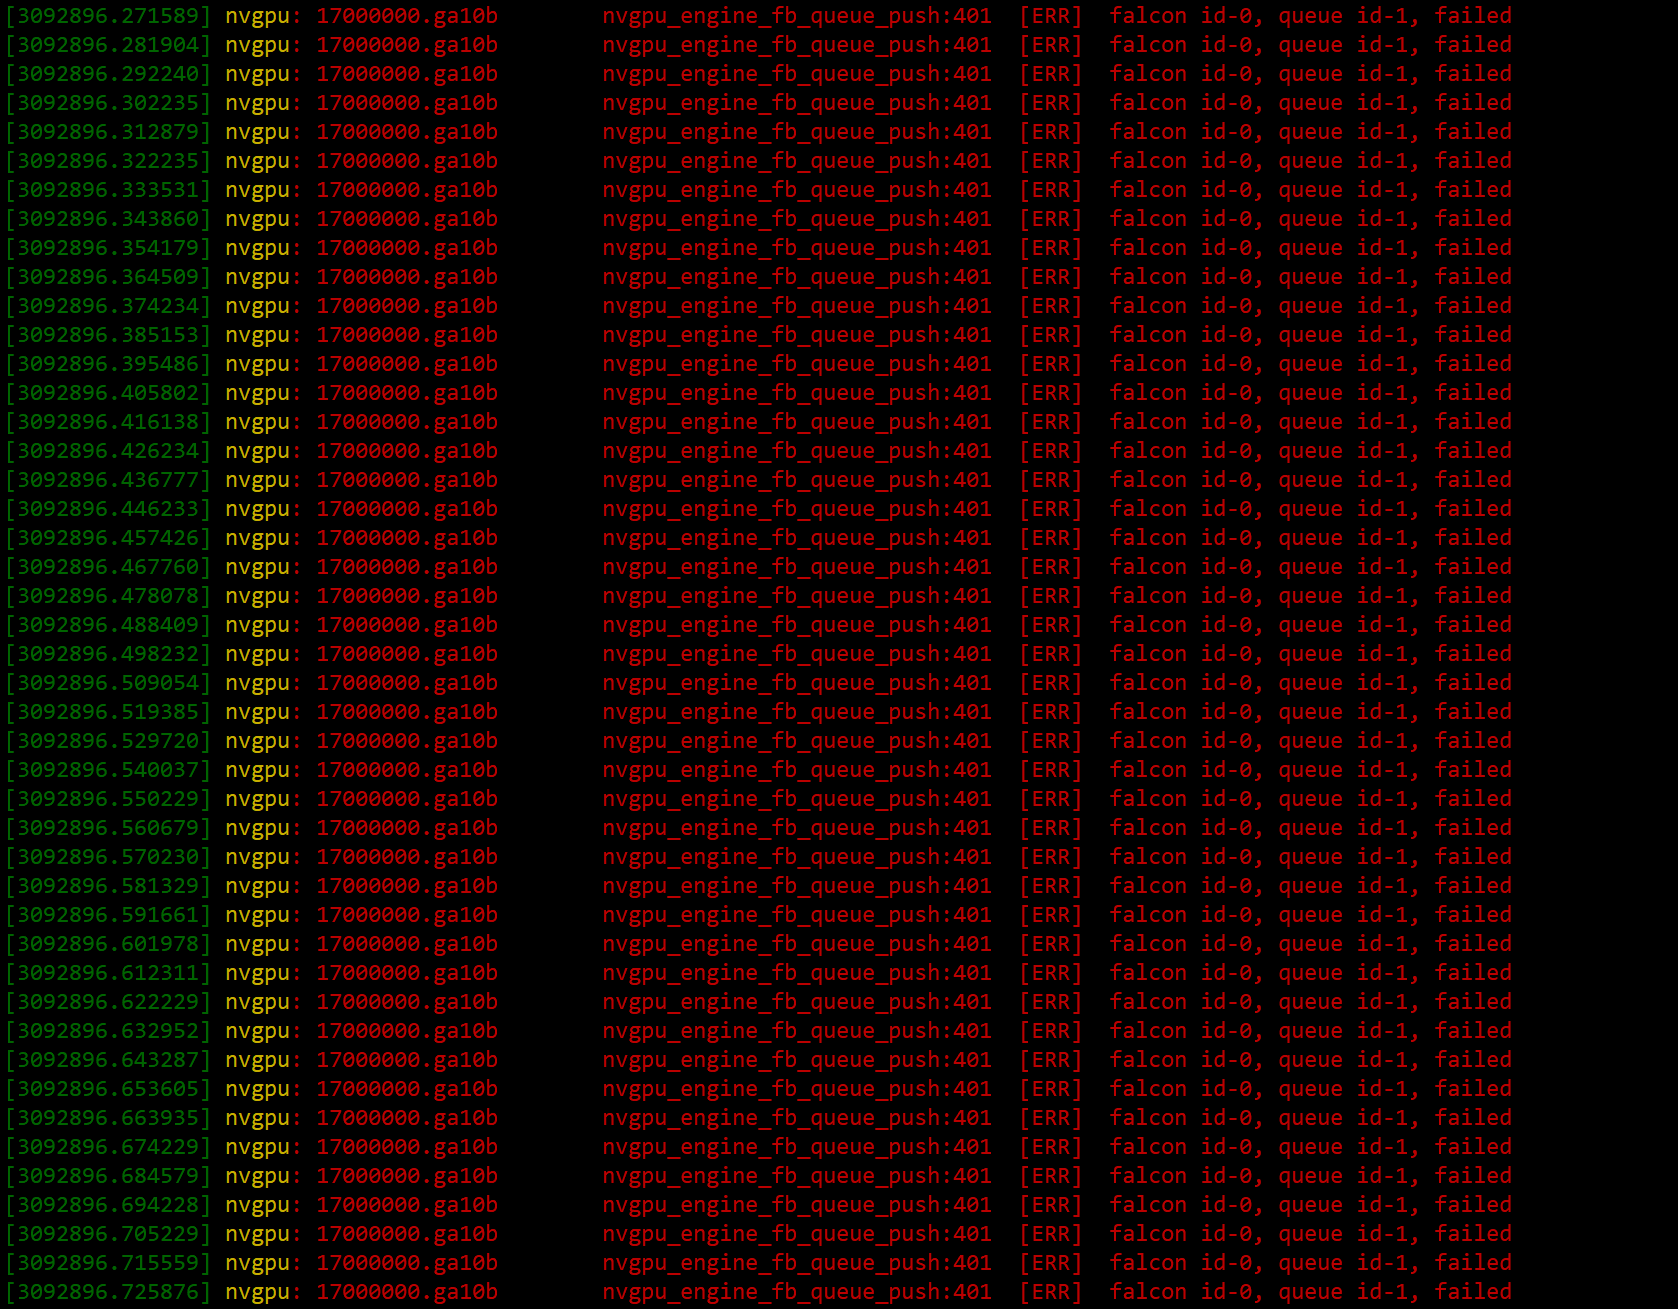
3、dmesg关于gpu info failed

[4396822.611090] nvgpu: 17000000.ga10b gv100_pmu_lsfm_init_acr_wpr_region:53   [ERR]  Failed to execute RPC status=0xfffffff4
[4396822.622334] nvgpu: 17000000.ga10b nvgpu_pmu_lsfm_bootstrap_ls_falcon:107  [ERR]  LSF init WPR region failed
[4396822.622628] nvgpu: 17000000.ga10b nvgpu_pmu_lsfm_bootstrap_ls_falcon:128  [ERR]  LSF Load failed
[4396822.622882] nvgpu: 17000000.ga10b nvgpu_gr_falcon_load_secure_ctxsw_ucode:714  [ERR]  Unable to recover GR falcon
[4396822.623162] nvgpu: 17000000.ga10b        nvgpu_gr_falcon_init_ctxsw:159  [ERR]  fail
[4396822.623385] nvgpu: 17000000.ga10b nvgpu_cic_mon_report_err_safety_services:92   [ERR]  Error reporting is not supported in this platform
[4396822.623718] nvgpu: 17000000.ga10b      gr_init_ctxsw_falcon_support:833  [ERR]  FECS context switch init error
[4396822.624002] nvgpu: 17000000.ga10b            nvgpu_finalize_poweron:1010 [ERR]  Failed initialization for: g->ops.gr.gr_init_support
[4396822.650606] nvgpu: 17000000.ga10b                 gk20a_power_write:127  [ERR]  power_node_write failed at busy
[4396833.710180] nvgpu: 17000000.ga10b                nvgpu_pmu_cmd_post:591  [ERR]  FBQ cmd setup failed
[4396833.710484] nvgpu: 17000000.ga10b             nvgpu_pmu_rpc_execute:713  [ERR]  Failed to execute RPC status=0xfffffff4, func=0x0
[4396833.710817] nvgpu: 17000000.ga10b gv100_pmu_lsfm_init_acr_wpr_region:53   [ERR]  Failed to execute RPC status=0xfffffff4
[4396833.722072] nvgpu: 17000000.ga10b nvgpu_pmu_lsfm_bootstrap_ls_falcon:107  [ERR]  LSF init WPR region failed
[4396833.722377] nvgpu: 17000000.ga10b nvgpu_pmu_lsfm_bootstrap_ls_falcon:128  [ERR]  LSF Load failed
[4396833.722624] nvgpu: 17000000.ga10b nvgpu_gr_falcon_load_secure_ctxsw_ucode:714  [ERR]  Unable to recover GR falcon
[4396833.722910] nvgpu: 17000000.ga10b        nvgpu_gr_falcon_init_ctxsw:159  [ERR]  fail
[4396833.723122] nvgpu: 17000000.ga10b nvgpu_cic_mon_report_err_safety_services:92   [ERR]  Error reporting is not supported in this platform
[4396833.723459] nvgpu: 17000000.ga10b      gr_init_ctxsw_falcon_support:833  [ERR]  FECS context switch init error
[4396833.723726] nvgpu: 17000000.ga10b            nvgpu_finalize_poweron:1010 [ERR]  Failed initialization for: g->ops.gr.gr_init_support
[4396833.750693] nvgpu: 17000000.ga10b                 gk20a_power_write:127  [ERR]  power_node_write failed at busy
[4396835.626139] nvgpu: 17000000.ga10b                nvgpu_pmu_cmd_post:591  [ERR]  FBQ cmd setup failed
[4396835.626429] nvgpu: 17000000.ga10b             nvgpu_pmu_rpc_execute:713  [ERR]  Failed to execute RPC status=0xfffffff4, func=0x0
[4396835.626782] nvgpu: 17000000.ga10b gv100_pmu_lsfm_init_acr_wpr_region:53   [ERR]  Failed to execute RPC status=0xfffffff4
[4396835.638032] nvgpu: 17000000.ga10b nvgpu_pmu_lsfm_bootstrap_ls_falcon:107  [ERR]  LSF init WPR region failed
[4396835.638327] nvgpu: 17000000.ga10b nvgpu_pmu_lsfm_bootstrap_ls_falcon:128  [ERR]  LSF Load failed
[4396835.638578] nvgpu: 17000000.ga10b nvgpu_gr_falcon_load_secure_ctxsw_ucode:714  [ERR]  Unable to recover GR falcon
[4396835.638875] nvgpu: 17000000.ga10b        nvgpu_gr_falcon_init_ctxsw:159  [ERR]  fail
[4396835.639104] nvgpu: 17000000.ga10b nvgpu_cic_mon_report_err_safety_services:92   [ERR]  Error reporting is not supported in this platform
[4396835.639436] nvgpu: 17000000.ga10b      gr_init_ctxsw_falcon_support:833  [ERR]  FECS context switch init error
[4396835.639702] nvgpu: 17000000.ga10b            nvgpu_finalize_poweron:1010 [ERR]  Failed initialization for: g->ops.gr.gr_init_support
[4396835.665634] nvgpu: 17000000.ga10b                 gk20a_power_write:127  [ERR]  power_node_write failed at busy
[4396846.765863] nvgpu: 17000000.ga10b                nvgpu_pmu_cmd_post:591  [ERR]  FBQ cmd setup failed
[4396846.766156] nvgpu: 17000000.ga10b             nvgpu_pmu_rpc_execute:713  [ERR]  Failed to execute RPC status=0xfffffff4, func=0x0
[4396846.766537] nvgpu: 17000000.ga10b gv100_pmu_lsfm_init_acr_wpr_region:53   [ERR]  Failed to execute RPC status=0xfffffff4
[4396846.777774] nvgpu: 17000000.ga10b nvgpu_pmu_lsfm_bootstrap_ls_falcon:107  [ERR]  LSF init WPR region failed
[4396846.778082] nvgpu: 17000000.ga10b nvgpu_pmu_lsfm_bootstrap_ls_falcon:128  [ERR]  LSF Load failed
[4396846.778331] nvgpu: 17000000.ga10b nvgpu_gr_falcon_load_secure_ctxsw_ucode:714  [ERR]  Unable to recover GR falcon

Our equipment is still malfunctioning, please assist in analyzing the cause. We will try our best to continuously power on and restart to destroy the malfunction。

Hi,

Do you use a custom board or AGX Orin devkit?
Please also try to reboot the system to see if the GPU can back to work.

Thanks.

1、We use customized boards
2、At present, there is no restart module, and I am worried that the phenomenon will disappear. Someone on the forum mentioned that there was no restart.
This phenomenon is obviously caused by a problem with the GPU driver. Do you have any ideas? Currently, three devices are reporting errors.

Hi,

Could you try if the same issue can be reproduced on the Orin devkit?
We will need to reproduce the same issue internally to gather more info first.

Thanks.

kernel output error:
[17538882.801114] os_dump_stack+0x18/0x20 [nvidia]
[17538882.801152] tlsEntryGet+0x130/0x138 [nvidia]
[17538882.801187] gpumgrGetSomeGpu+0x7c/0x90 [nvidia]
[17538882.801222] threadPriorityStateFree+0x234/0x2a0 [nvidia]
[17538882.801256] RmShutdownAdapter+0x168/0x268 [nvidia]
[17538882.801290] rm_shutdown_adapter+0x50/0x70 [nvidia]
[17538882.801324] nv_shutdown_adapter+0xb4/0x4b0 [nvidia]
[17538882.801358] nv_shutdown_adapter+0x2d8/0x4b0 [nvidia]
[17538882.801393] nv_shutdown_adapter+0x3a0/0x4b0 [nvidia]
[17538882.801428] nvidia_dev_put+0xa94/0xc40 [nvidia]
[17538882.801462] nvidia_frontend_close+0x50/0x78 [nvidia]

GPU clock information of the problematic device

image
We default to enabling maximum power consumption, but the clock is not locked and the GPU has not been called for a long time. Did the GPU enter low-power mode due to prolonged inactivity

Before the error message “libnvrm_gpu. so: NvRmGpuLibOpen failed, error=6” was reported, the system had very little free memory space and both jtop and tegrastats entered were stuck. May I ask if these situations are related to the error message?
image

Hi,

Sorry for the late update.
Just want to double-confirm the behavior to collect more info:

  1. Does the CPU or system stall when the GPU locks down? If yes, is the system rebooted by the watchdog?
  2. Have you met this on Devkit?
  3. Are you able to share reproducible steps so we can try it internally?
    We need further logs to know more about the exact cause.

Thanks.

Hi:

  1. No hardware watchdog has been set up. We suspect that the oom killer mechanism was triggered due to the depletion of system memory, resulting in the killing of GPU related services. Due to the 7-day rotation of system logs, no relevant logs were captured.

  2. We are using customized AGX Orin (32GB) boards

  3. The issue has already occurred on 3 devices, and we have extended the system log rotation by 1 year. We are currently reproducing it (it has been 1 month)

I wonder if the options available in this script could help with oom?

https://github.com/dusty-nv/jetson-containers/blob/master/scripts/optimize-ram-usage.sh

Hi,

Do you mean you are trying to find a reproducible source and share it with us?
Based on your description, the system doesn’t reboot but just GPU lockup, is that correct?

Thanks.

Yes, we are testing as expected

The system did not restart, and the kernel lock may have been on the GPU, but no valid logs were captured。

Hi,

In the mean time, could you share the output of below two commands with us?

$ sudo tegrastats
$ sudo cat /sys/kernel/debug/gpu.0/status

Thanks.

Stuck with no output, jtop command also freezes with no output

"/sys/kernel/debug/gpu.0/"directory is not functioning properly, and many nodes are missing compared to the normal situation.

Due to the current failure not being replicated, the specific value of/sys/kernel/debug/gpu.0/status is unknown.

Normal module:
image
cat /dev/nvgpu/igpu0/power return:2=
Abnormal module:


cat /dev/nvgpu/igpu0/power return:0

Hi,

It is not expected that the status node doesn’t exist.

Do you find a way (or sample) to reproduce this issue?
If yes, could you share with us so we can give it a try?

Thanks.

We are actually using thousands of units, among which there must still be this issue, but it has not been discovered yet. If the device is found to have this phenomenon, are there any auxiliary operations available? For example, saving logs.

We have been monitoring two devices (the ones that had problems before) for a month, but they have not been reproduced.

Hi,

Please try to collect the below logs on the normal and lockup environment:

$ sudo tegrastats
$ sudo cat /sys/kernel/debug/gpu.0/gr_status
$ sudo cat /sys/kernel/debug/gpu.0/status

Please also check if any errors or related logs show up in the dmesg when issue happens:

$ sudo dmesg

Thanks.