HI, I have an issue on Jetson Orin 32G model with JP 5.0.2 GA
After running a 12-way camera model for about 2 or 3 days ,kernel generated the following error:
kernel:[951860.733443] BUG: workqueue lockup - pool cpus=0 node=0 flags=0x0 nice=0 stuck for xxs
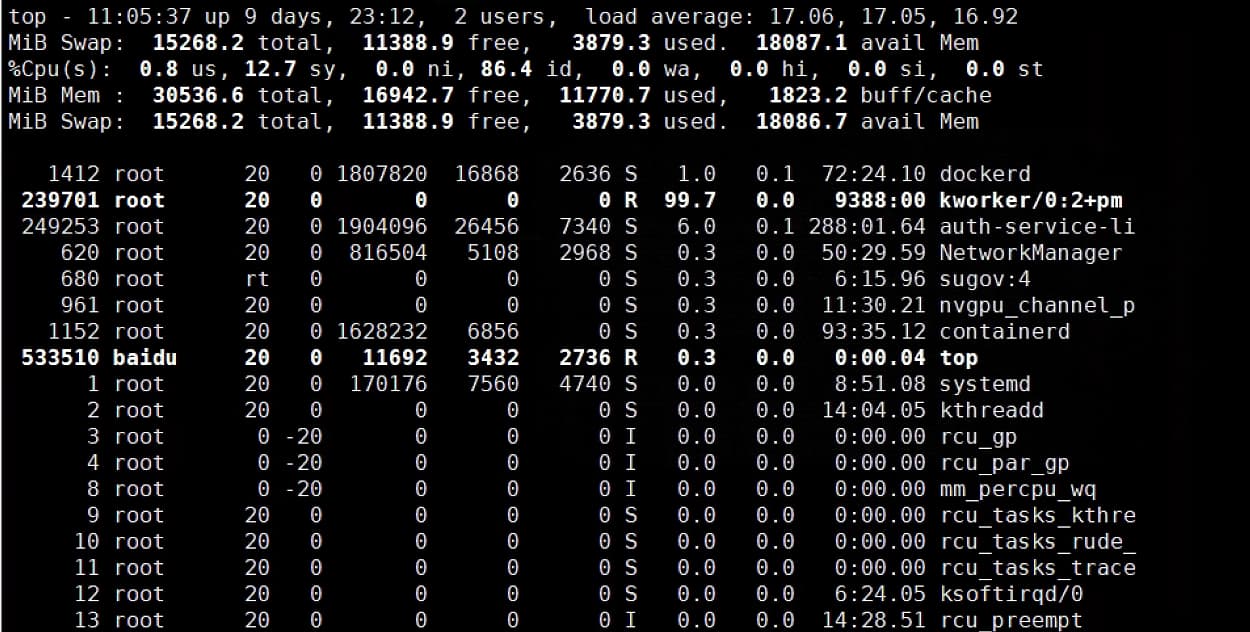
At this time, view the top command:
and tegrastats will stuck and can not be stopped by ctrl+c,I can only open another ssh terminal to exec other command
This issue happened on some of our carrier board with orin,and The kernel is compiled by ourselves with a rtc patch on forum;
After hardware restart,the issue will disappear,but I am not sure if it will happen again
Did you get to the bottom of this problem, please?
I am also experiencing it on a Jetson AGX Orin while training using Keras and Tensorflow. It rapidly (after a few training epochs) locks up as described by the OP. The syslog records the following over and over. All I can do is force reboot,
Mar 23 20:00:25 ubuntu kernel: [ 8971.721880] BUG: workqueue lockup - pool cpus=3 node=0 flags=0x0 nice=0 stuck for 7432s!
Mar 23 20:00:25 ubuntu kernel: [ 8971.730253] Showing busy workqueues and worker pools:
Mar 23 20:00:25 ubuntu kernel: [ 8971.730266] workqueue mm_percpu_wq: flags=0x8
Mar 23 20:00:25 ubuntu kernel: [ 8971.730268] pwq 6: cpus=3 node=0 flags=0x0 nice=0 active=2/256 refcnt=4
Mar 23 20:00:25 ubuntu kernel: [ 8971.730273] pending: drain_local_pages_wq BAR(2943), vmstat_update
Mar 23 20:00:25 ubuntu kernel: [ 8971.730291] workqueue pm: flags=0x4
Mar 23 20:00:25 ubuntu kernel: [ 8971.730292] pwq 6: cpus=3 node=0 flags=0x0 nice=0 active=3/256 refcnt=4
Mar 23 20:00:25 ubuntu kernel: [ 8971.730296] in-flight: 205:pm_runtime_work
Mar 23 20:00:25 ubuntu kernel: [ 8971.730303] pending: pm_runtime_work, pm_runtime_work
Mar 23 20:00:25 ubuntu kernel: [ 8971.730346] pool 6: cpus=3 node=0 flags=0x0 nice=0 hung=7433s workers=3 idle: 3336 3159
‘top’ shows kworker process with the CPU at 100%.
I’ve recently (within the last week) flashed it with the latest SDK and jetpack.
I have some new clues for the issue.
We use ffmpeg to soft-decode the streams of 12 cameras, resulting in a relatively large CPU and memory load.When the memory is exhausted, the oom mechanism of linux will kill our program, and then the program will be restarted by our service.
This loop will continue until the issue happen.
When we lowered the frame rate of the stream from 25 to 12, the issue disappeared. This may be related to the decoding ability of ffmpeg.
But,I think this issue is related to the nvgpu driver, some calls may cause the cpu to be locked.
In addition, our project has been based on JP5.0.2 for a long time, and switching to JP5.1.0 will have more work, so we will not consider upgrading to JP5.1.0 for the time being.
I see that other replies indicate that the latest version also has this problem
Hi, based on this log, we are still not quite sure about the cause of this issue.
Could you please provide us with a complete steps to re-produce it?
Like for training deep learning models, we need to know the code and the version of DL frameworks.
Hi, I have the same problem BUG: workqueue lockup - pool cpus=7 node=0 flags=0x0 nice=0 stuck for 27464s! , in my case I use a Realsense 415 with Orin 5.0.2 and a Realsense 455 with the same JetPack, our application read frames from the camera with a process in python 3.8, but after sometime the camera dissapears and I can’t find it with a lsusb command, the only solution is to restart the Jetson and the camera appears and our applications works again, but watching my kernel I found the same error as you post, one the CPU’s was in 100% and the memory was full, have you made some advance on these problems?
I haven’t upgraded to the latest Jetpack yet. I will soon. However, in the meantime, I have been managing the problem by limiting memory usage and using some workarounds, and can fairly reliably avoid it happening now.
My issues occured while using tensorflow, and my workarounds were all the following together:
Enabling dynamic memory allocation in tensorflow
# enable dynamic memory allocation
gpu_devices = tf.config.experimental.list_physical_devices('GPU')
for device in gpu_devices:
    tf.config.experimental.set_memory_growth(device, True)
Smaller batch sizes. This takes some trial and error. If the batch size is too big, it’s guaranteed to trigger the problem sooner or later.