I’m running into memory and CPU issues using DeepStream libnvds_nvmultiobjecttracker with nvDCF tracker config. It looks like the issue comes from the tracker and I kinda have a feeling it’s because of stationary objects (parking cars) being endlessly tracked. Both memory and CPU usage is growing slowly, but endlessly.
Is there some config parameter to say “start tracking only if the detected object have at least this amount of movement”? Can this even be an issue? Any help is appreciated. :)
Here is my tracker configuration:
BaseConfig:
  minDetectorConfidence: 0   # If the confidence of a detector bbox is lower than this, then it won't be considered for tracking

TargetManagement:
  enableBboxUnClipping: 1   # In case the bbox is likely to be clipped by image border, unclip bbox
  maxTargetsPerStream: 150  # Max number of targets to track per stream. Recommended to set >10. Note: this value should account for the targets being tracked in shadow mode as well. Max value depends on the GPU memory capacity

  # [Creation & Termination Policy]
  minIouDiff4NewTarget: 0.5   # If the IOU between the newly detected object and any of the existing targets is higher than this threshold, this newly detected object will be discarded.
  minTrackerConfidence: 0.2   # If the confidence of an object tracker is lower than this on the fly, then it will be tracked in shadow mode. Valid Range: [0.0, 1.0]
  probationAge: 3 # If the target's age exceeds this, the target will be considered to be valid.
  maxShadowTrackingAge: 150   # Max length of shadow tracking. If the shadowTrackingAge exceeds this limit, the tracker will be terminated.
  earlyTerminationAge: 1      # If the shadowTrackingAge reaches this threshold while in TENTATIVE period, the target will be terminated prematurely.

TrajectoryManagement:
  useUniqueID: 0   # Use 64-bit long Unique ID when assignining tracker ID.
  enableReAssoc: 1    # Enable Re-Assoc

  # [Re-Assoc: Motion-based]
  minTrajectoryLength4Projection: 20  # min trajectory length required to make projected trajectory
  prepLength4TrajectoryProjection: 10  # the length of the trajectory during which the state estimator is updated to make projections
  trajectoryProjectionLength: 90  # the length of the projected trajectory

  # [Re-Assoc: Trajectory Similarity]
  minTrackletMatchingScore: 0.5   # min tracklet similarity score for matching
  maxAngle4TrackletMatching: 30   # max angle difference for tracklet matching [degree]
  minSpeedSimilarity4TrackletMatching: 0.2 # min speed similarity for tracklet matching
  minBboxSizeSimilarity4TrackletMatching: 0.6 # min bbox size similarity for tracklet matching
  maxTrackletMatchingTimeSearchRange: 20      # the search space in time for max tracklet similarity

DataAssociator:
  dataAssociatorType: 0 # the type of data associator among { DEFAULT= 0 }
  associationMatcherType: 0 # the type of matching algorithm among { GREEDY=0, GLOBAL=1 }
  checkClassMatch: 1  # If checked, only the same-class objects are associated with each other. Default: true

  # [Association Metric: Thresholds for valid candidates]
  minMatchingScore4Overall: 0.0   # Min total score
  minMatchingScore4SizeSimilarity: 0.5  # Min bbox size similarity score
  minMatchingScore4Iou: 0.3       # Min IOU score
  minMatchingScore4VisualSimilarity: 0.6  # Min visual similarity score

  # [Association Metric: Weights]
  matchingScoreWeight4VisualSimilarity: 0.5  # Weight for the visual similarity (in terms of correlation response ratio)
  matchingScoreWeight4SizeSimilarity: 0.0    # Weight for the Size-similarity score
  matchingScoreWeight4Iou: 0.1   # Weight for the IOU score

StateEstimator:
  stateEstimatorType: 1  # the type of state estimator among { DUMMY=0, SIMPLE=1, REGULAR=2 }

  # [Dynamics Modeling]
  processNoiseVar4Loc: 2.0    # Process noise variance for bbox center
  processNoiseVar4Size: 1.0   # Process noise variance for bbox size
  processNoiseVar4Vel: 0.1    # Process noise variance for velocity
  measurementNoiseVar4Detector: 2.0    # Measurement noise variance for detector's detection
  measurementNoiseVar4Tracker: 10.0    # Measurement noise variance for tracker's localization

VisualTracker:
  visualTrackerType: 1 # the type of visual tracker among { DUMMY=0, NvDCF=1 }

  # [NvDCF: Feature Extraction]
  useColorNames: 1     # Use ColorNames feature
  useHog: 1            # Use Histogram-of-Oriented-Gradient (HOG) feature
  featureImgSizeLevel: 3  # Size of a feature image. Valid range: {1, 2, 3, 4, 5}, from the smallest to the largest
  featureFocusOffsetFactor_y: -0.2 # The offset for the center of hanning window relative to the feature height. The center of hanning window would move by (featureFocusOffsetFactor_y*featureMatSize.height) in vertical direction

  # [NvDCF: Correlation Filter]
  filterLr: 0.075 # learning rate for DCF filter in exponential moving average. Valid Range: [0.0, 1.0]
  filterChannelWeightsLr: 0.1 # learning rate for the channel weights among feature channels. Valid Range: [0.0, 1.0]
  gaussianSigma: 0.75 # Standard deviation for Gaussian for desired response when creating DCF filter [pixels]
I tried it with Deepstream 6.1, same result. I guess it happens because I have demo streams which are 1hour long looping HLS streams and some of them have stationary cars parked. I guess these stationary cars will have endless tracks because it’s a looping video. I can see that the issue comes from nvtracker after using gdb to see which thread is using the most CPU time.
Is there some config parameter to say “only start tracking if the object have moved at least this amount”? Or somehow reset tracking after track has been active for more than n minutes?
I have previously used both IOU and DeepSORT, but I need to use NvDCF specifically.
Is there some config parameter to say “only start tracking if the object have moved at least this amount”? Or somehow reset tracking after track has been active for more than n minutes?
@mpukkonen Can you let us know if this is still an issue?
And back to question raised by kesong, can you share more clues that the memory leakage is caused by stationary cars? Thanks to share some information (reproducing steps, logs, video if possible) so we can reproduce in our side, thanks.
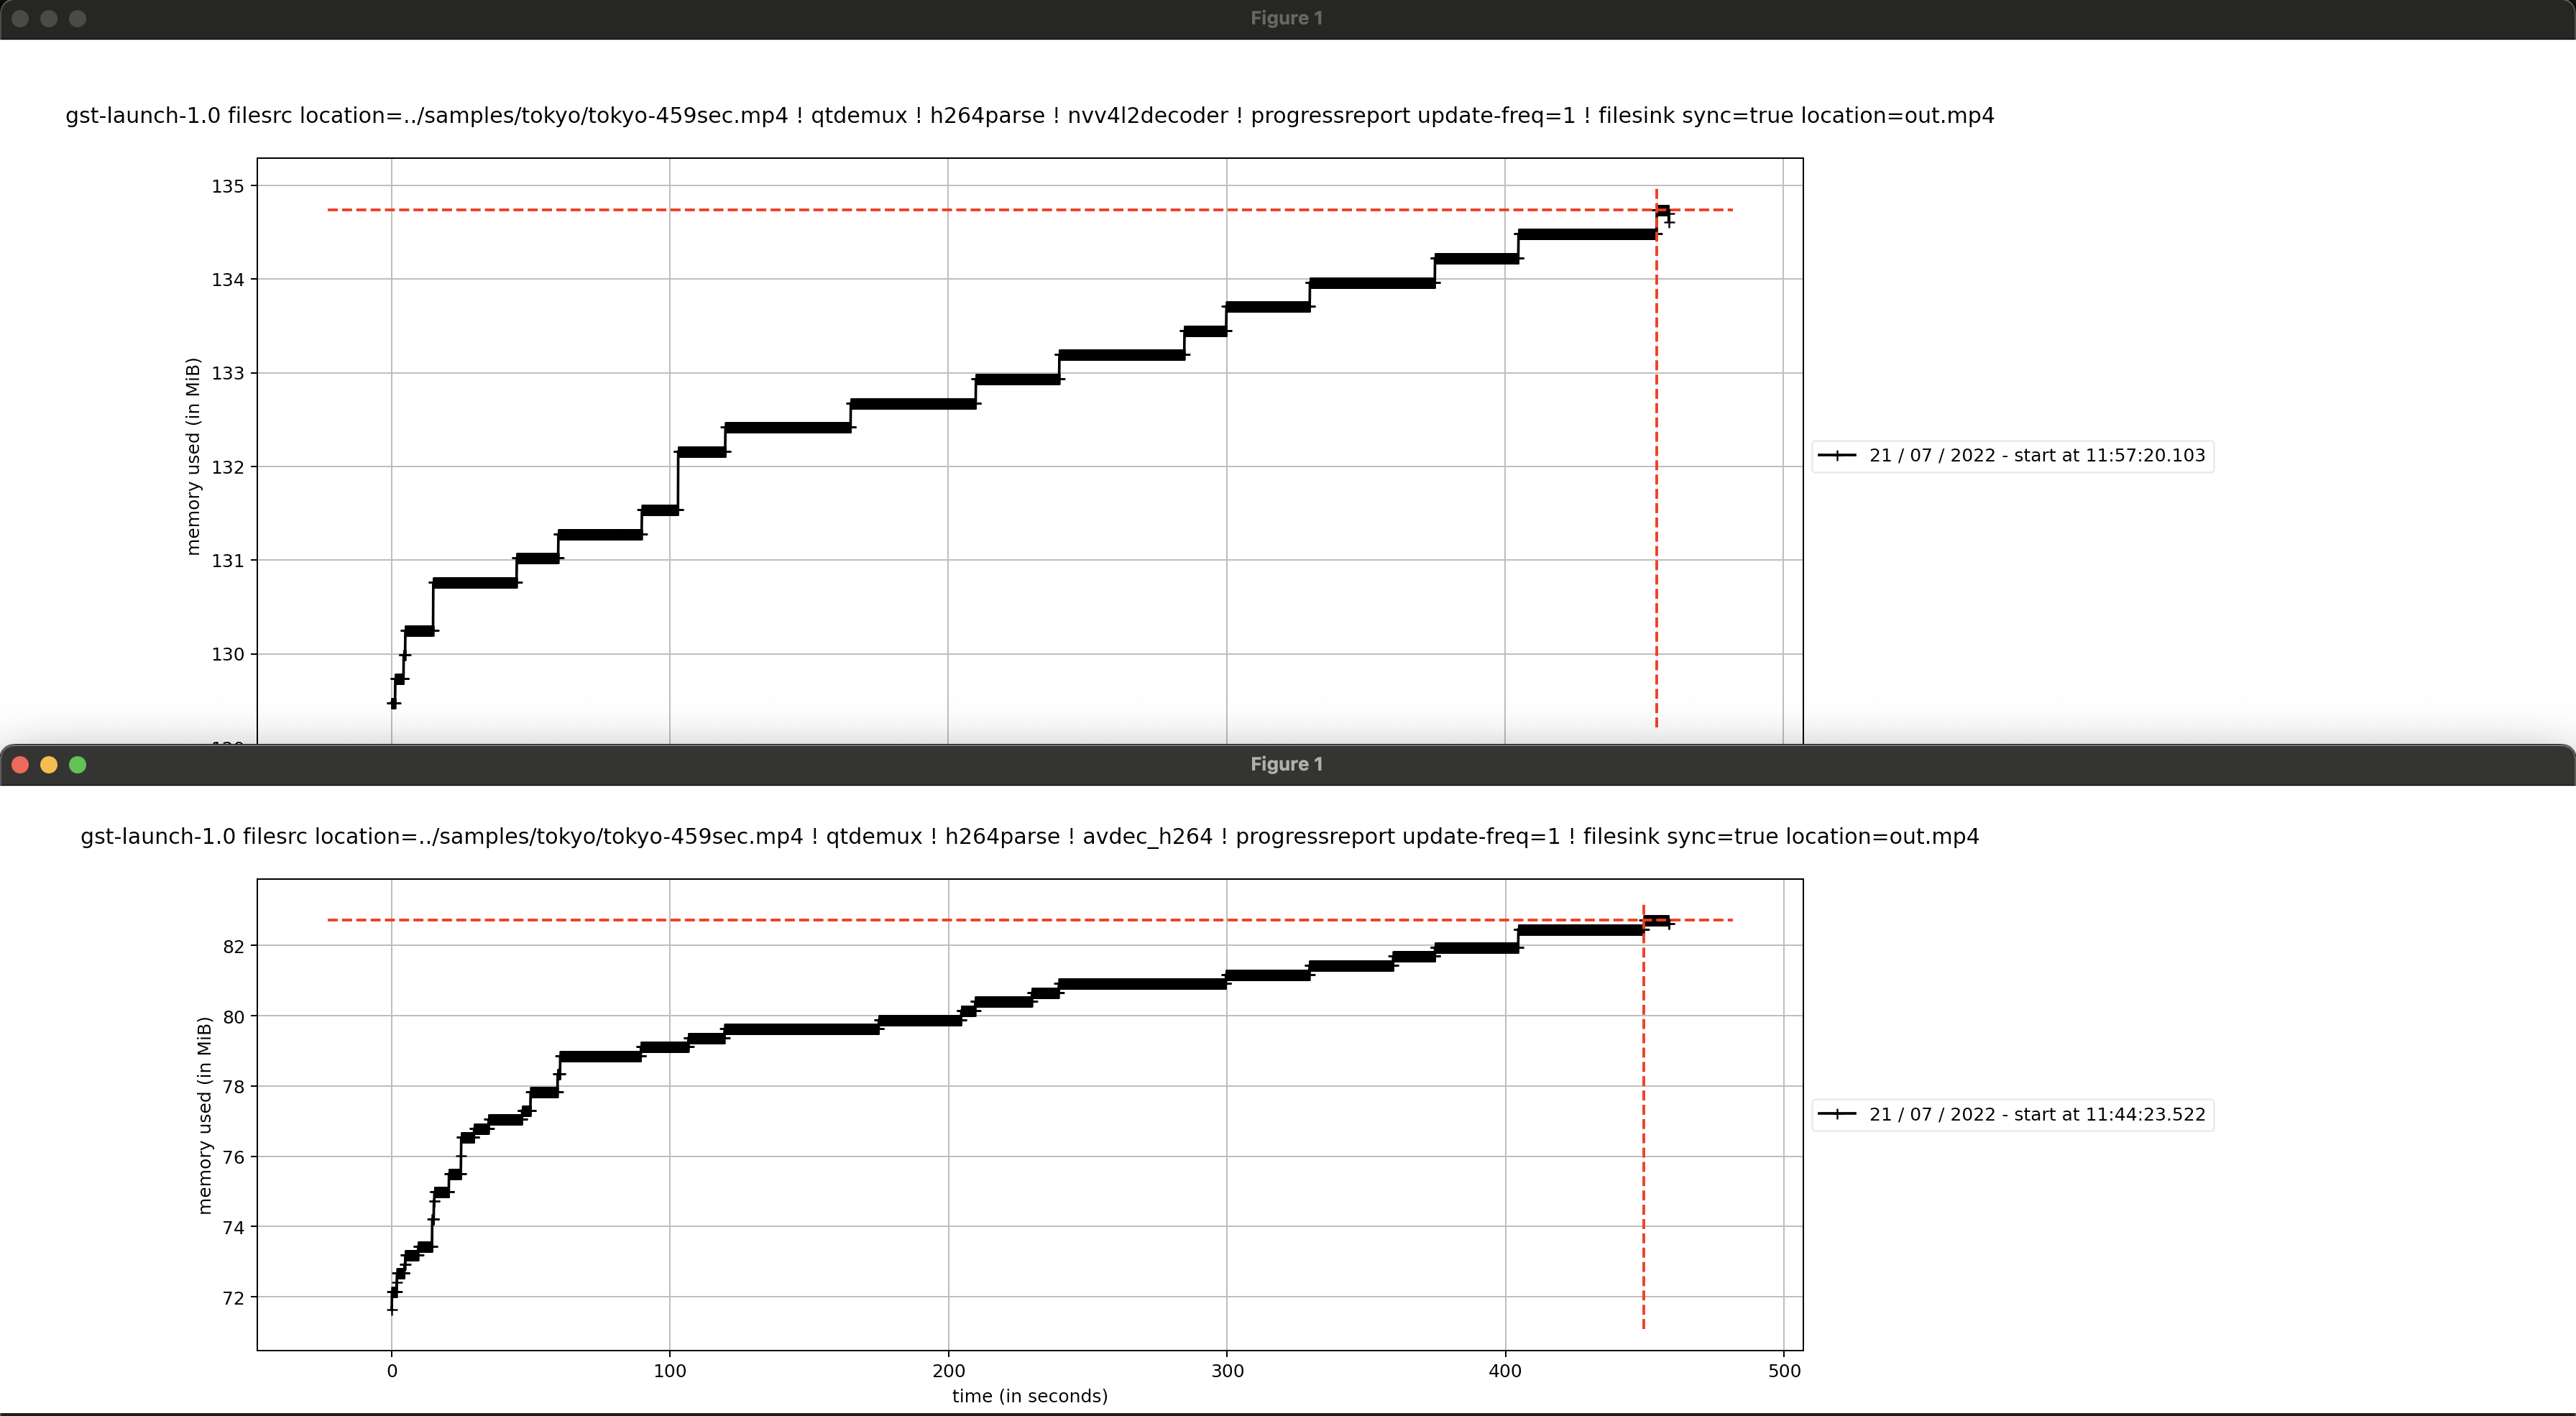
I tried to reduce all unnecessary components from my deepstream pipeline and run it with gst-launch-1.0. There seems to be an issue with constantly growing memory having a rather simple gstreamer pipeline.
Using this tool for memory profiling: mprof
I know it’s not specifically a deepstream issue, but that doesn’t look scalable. Do you happen to have any idea why the memory is constantly growing? It’s the same when I run it using deepstream.
==308609== HEAP SUMMARY:
==308609==     in use at exit: 9,828,670 bytes in 12,276 blocks
==308609==   total heap usage: 122,717 allocs, 110,441 frees, 3,284,469,481 bytes allocated
==308609==
==308609== 8 bytes in 1 blocks are definitely lost in loss record 132 of 4,009
==308609==    at 0x483B7F3: malloc (vg_replace_malloc.c:309)
==308609==    by 0x6E5032B: ???
==308609==    by 0x6E59E3A: ???
==308609==    by 0x6E4F95C: ???
==308609==    by 0x681343A: ???
==308609==    by 0x682108D: v4l2_ioctl (in /opt/nvidia/deepstream/deepstream-6.1/lib/libnvv4l2.so)
==308609==    by 0x67C9228: ??? (in /opt/nvidia/deepstream/deepstream-6.1/lib/gst-plugins/libgstnvvideo4linux2.so)
==308609==    by 0x67CD41E: gst_v4l2_buffer_pool_process (in /opt/nvidia/deepstream/deepstream-6.1/lib/gst-plugins/libgstnvvideo4linux2.so)
==308609==    by 0x67E22AF: ??? (in /opt/nvidia/deepstream/deepstream-6.1/lib/gst-plugins/libgstnvvideo4linux2.so)
==308609==    by 0x6598B4F: ??? (in /usr/lib/x86_64-linux-gnu/libgstvideo-1.0.so.0.1602.0)
==308609==    by 0x48E1EFE: ??? (in /usr/lib/x86_64-linux-gnu/libgstreamer-1.0.so.0.1602.0)
==308609==    by 0x48E3F60: ??? (in /usr/lib/x86_64-linux-gnu/libgstreamer-1.0.so.0.1602.0)
==308609==    by 0x48EAD72: gst_pad_push (in /usr/lib/x86_64-linux-gnu/libgstreamer-1.0.so.0.1602.0)
==308609==    by 0x646943F: ??? (in /usr/lib/x86_64-linux-gnu/libgstbase-1.0.so.0.1602.0)
==308609==    by 0x48E1EFE: ??? (in /usr/lib/x86_64-linux-gnu/libgstreamer-1.0.so.0.1602.0)
==308609==    by 0x48E3F60: ??? (in /usr/lib/x86_64-linux-gnu/libgstreamer-1.0.so.0.1602.0)
==308609==    by 0x48EAD72: gst_pad_push (in /usr/lib/x86_64-linux-gnu/libgstreamer-1.0.so.0.1602.0)
==308609==    by 0x658A8A4: ??? (in /usr/lib/x86_64-linux-gnu/libgstvideo-1.0.so.0.1602.0)
==308609==    by 0x6591FFA: gst_video_decoder_finish_frame (in /usr/lib/x86_64-linux-gnu/libgstvideo-1.0.so.0.1602.0)
==308609==    by 0x67E0D2F: ??? (in /opt/nvidia/deepstream/deepstream-6.1/lib/gst-plugins/libgstnvvideo4linux2.so)
==308609==    by 0x4919106: ??? (in /usr/lib/x86_64-linux-gnu/libgstreamer-1.0.so.0.1602.0)
==308609==    by 0x4A8A373: ??? (in /usr/lib/x86_64-linux-gnu/libglib-2.0.so.0.6400.6)
==308609==    by 0x4A89AD0: ??? (in /usr/lib/x86_64-linux-gnu/libglib-2.0.so.0.6400.6)
==308609==    by 0x4B3F608: start_thread (pthread_create.c:477)
==308609==    by 0x4C7B132: clone (clone.S:95)
==308609==
==308609== 16,384 bytes in 1 blocks are definitely lost in loss record 3,951 of 4,009
==308609==    at 0x483B7F3: malloc (vg_replace_malloc.c:309)
==308609==    by 0x4A65E98: g_malloc (in /usr/lib/x86_64-linux-gnu/libglib-2.0.so.0.6400.6)
==308609==    by 0x4A707D3: ??? (in /usr/lib/x86_64-linux-gnu/libglib-2.0.so.0.6400.6)
==308609==    by 0x4011B99: call_init.part.0 (dl-init.c:72)
==308609==    by 0x4011CA0: call_init (dl-init.c:30)
==308609==    by 0x4011CA0: _dl_init (dl-init.c:119)
==308609==    by 0x4001139: ??? (in /usr/lib/x86_64-linux-gnu/ld-2.31.so)
==308609==    by 0x15: ???
==308609==    by 0x1FFF000152: ???
==308609==    by 0x1FFF000161: ???
==308609==    by 0x1FFF000169: ???
==308609==    by 0x1FFF00018C: ???
==308609==    by 0x1FFF00018E: ???
==308609==    by 0x1FFF000196: ???
==308609==    by 0x1FFF000198: ???
==308609==    by 0x1FFF0001A2: ???
==308609==    by 0x1FFF0001A4: ???
==308609==    by 0x1FFF0001B2: ???
==308609==    by 0x1FFF0001B4: ???
==308609==    by 0x1FFF0001C3: ???
==308609==    by 0x1FFF0001D1: ???
==308609==    by 0x1FFF0001D3: ???
==308609==    by 0x1FFF0001E1: ???
==308609==    by 0x1FFF0001F1: ???
==308609==    by 0x1FFF0001F3: ???
==308609==    by 0x1FFF0001FD: ???
==308609==    by 0x1FFF0001FF: ???
==308609==    by 0x1FFF000206: ???
==308609==    by 0x1FFF000208: ???
==308609==    by 0x1FFF000211: ???
==308609==
==308609== LEAK SUMMARY:
==308609==    definitely lost: 16,392 bytes in 2 blocks
==308609==    indirectly lost: 0 bytes in 0 blocks
==308609==      possibly lost: 34,244 bytes in 238 blocks
==308609==    still reachable: 9,762,346 bytes in 11,919 blocks
==308609==                       of which reachable via heuristic:
==308609==                         length64           : 1,104 bytes in 21 blocks
==308609==                         newarray           : 1,664 bytes in 24 blocks
==308609==         suppressed: 0 bytes in 0 blocks
==308609== Reachable blocks (those to which a pointer was found) are not shown.
==308609== To see them, rerun with: --leak-check=full --show-leak-kinds=all
==308609==
==308609== For lists of detected and suppressed errors, rerun with: -s
==308609== ERROR SUMMARY: 240 errors from 240 contexts (suppressed: 0 from 0)
The “still reachable” category within Valgrind’s leak report refers to “memory was allocated and was not subsequently freed before the program terminated.” I guess that is the main issue. When I look at htop I can see RES memory endlessly growing while my pipeline is running. In other words it doesn’t look like the strict definition of a memory leak: “memory was allocated and cannot be subsequently freed because the program no longer has any pointers to the allocated memory block.” Do you have any clue why it happens?
I have a lot of cameras running in deepstream and this is how the container_memory_rss graph looks. :|
Hello @mpukkonen ,
As it is not tracker issue and memory leakage issue in v4l2decoeder is disucssing in “Nvv4l2decoder memory issue”, hense we are going to close this topic, thank you.