Hello,
I’ve been using nsight-system and nsight-compute for profiling my inference code.
Actually, my code which is based on the huggingface transformers example works well, and nsight-system works well too.
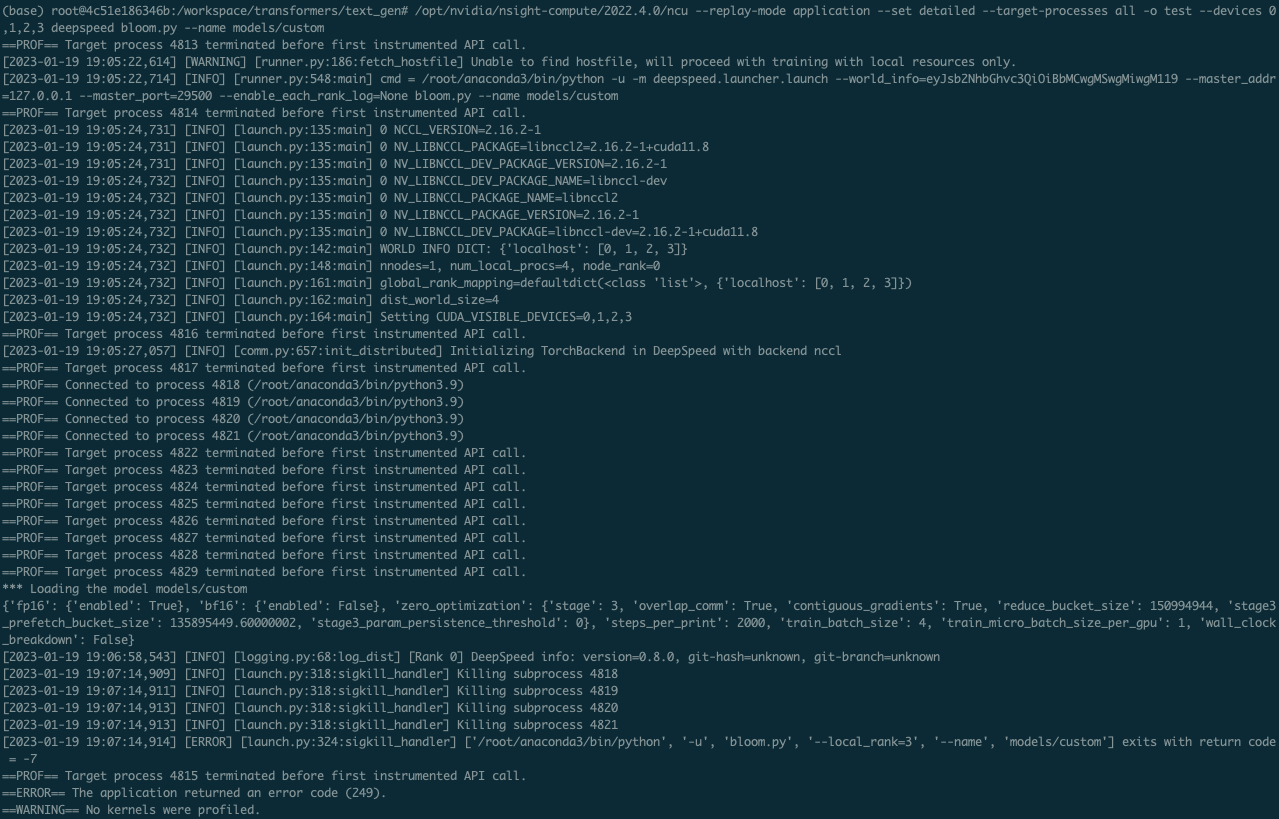
However, when if I try to profile it with ncu, it doesn’t show any specific error message like attached image. So I can’t check what cause this error.
I’m a quite new to nsight tools, so any comment would be helpful.
Is there any documentation I should check?
Or, profiling didn’t proceed after stopping at the first broadcast kernel like below.
My environment is like follows:
I am using nvidia/cuda:11.8.0-devel-ubuntu20.04 container
cuda(nvcc) 11.8
cuda driver : 515.86.01
pytorch 1.13.1
For the first screenshot, Nsight Compute is reporting that no CUDA APIs were encountered during the profile and then the application is throwing an error. Could you share the output of the application without profiling to see what it’s supposed to look like?
For the second screenshot, it’s clear you’re using NCCL and there is a limitation in Nsight Compute that serializes kernels. For NCCL, this means kernels that need to run in parallel for communication can hang, like you’re seeing. For this reason, we created Range Replay . You will need to add API calls to specify the range and use the “–replay-mode range” to get the kernels profiled in parallel. Currently it isn’t compatible with application replay, but we are working on that feature.
1 Like
Thanks for your kind answer, @jmarusarz.
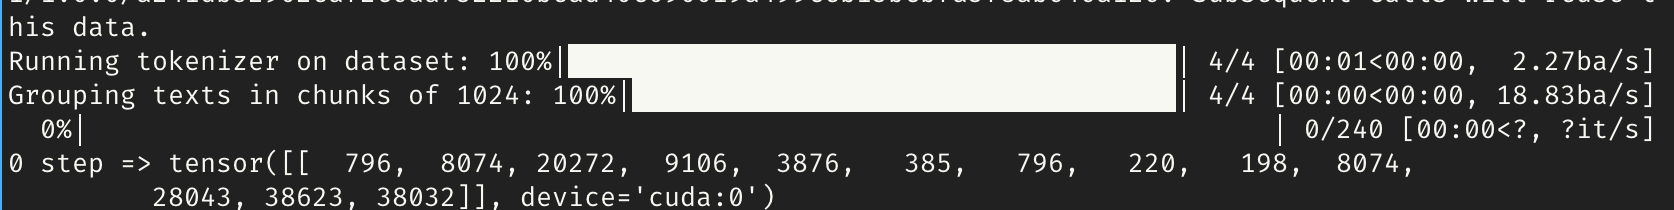
For the first one, it is code for the text-generation. Because I just want to profile what parts of the model is overhead, I’m using single dummy input. Output looks like below screenshot.
For the second thing, that’s true. I want to inference with multi-gpu, so it might use NCCL collective things. I checked documentation you linked. And I’m working with python, so I tried some stuff like below code based on googling results. But it doesn’t work…
import torch
import torch.cuda.profiler as profiler

with torch.autograd.profiler.emit_nvtx():
    profiler.start()
    model.generate()
    profiler.stop()
I’m sorry that I’m bothering you because I don’t know about it well. if you’ll excuse me, can you share the simple example python code?
Thanks
For the first case, the lines like [INFO] and [WARNING] are from your application, not ncu, correct? Can you share more of the output from running without ncu? It still includes those lines, right? I’d like to see the output from the ncu failure and compare to the non-ncu to see where the discrepancy is.
For the second one, I don’t have a pytorch sample using NCCL available so I’m trying to troubleshoot based on what you can share. Did you use the range profile mode flag once you inserted those APIs? Can you share your CLI command and output from that new version with the start/stop API?
Thanks @jmarusarz .
For the first case, the lines like [INFO] and [WARNING] are from your application, not ncu, correct? Can you share more of the output from running without ncu? It still includes those lines, right?
Yes, that’s true. INFO and WARNING are from deepspeed.
Entire outputs without/with ncu are in the attached txt file.
out.txt (13.8 KB)
with_ncu_out.txt (15.4 KB)
For the second one, I don’t have a pytorch sample using NCCL available so I’m trying to troubleshoot based on what you can share. Did you use the range profile mode flag once you inserted those APIs? Can you share your CLI command and output from that new version with the start/stop API?
Yes, I used the range profile mode flag. My CLI command is ncu --replay-mode range --set default --target-processes all -o test bash test.sh and I put that profiler.start/stop API into “test.py” like follow screenshot.

and deepspeed option I used in test.sh is only “–num_gpus” like below.
deepspeed --num_gpus 4 test.py \
    --model_type gpt2 \
    --model_name_or_path 'models/custom' \
    --length 13 \
    --dataset_name wikitext \
    --dataset_config_name wikitext-2-raw-v1 \
    --context 10 --num_sample_to_iter 1 \
    --per_device_eval_batch_size 1 \
    --custom_model
Could you run an Nsight Systems profile on the first case and share the results? Nsight Compute seems to be attaching to the python processes, and you’ve set the flag to follow children, but its not seeing any CUDA kernels. I’d like to verify that detectable CUDA kernels are being launched.