When I run nsight system with CLI command, what can I do to solve the compiling error?
I am using Windows 11, python3.9 and GeForce RTX 3090
The picture cannot be uploaded. The error message is as follows
pycuda.driver.CompileError: nvcc preprocessing of C:\Users\Jinyun\AppData\Local\Temp\tmpk1bi4nhw.cu failed
[command: nvcc --preprocess -arch sm_86 -m64 -IC:\Users\Jinyun\.conda\envs\Jinyunwork\lib\site-packages\pycuda\cuda C:\Users\Jinyun\AppData\Local\Temp\tmpk1bi4nhw.cu --compiler-options -EP]
Nsight Systems isn’t a compile time operation, are you using a different tool?
What is the command line you are using?
- Here is the command line I used
nsys profile --trace=cuda C:\Users\Jinyun\.conda\envs\Jinyunwork\python.exe test_nsight.py
It’s worth noting that the program works if I don’t use the nsight system for analysis
I think the parsing system is having an issue with the way you are launching the python script.
Can you try a couple of things:
 Can you put quotation marks around the path to your python?

 Can you put the python call into a script, so you just call nsys on the script?
@dofek do you have any other suggestions?
Thank you for your reply, but it seems that the above method does not work. I tried to parse my python program using a GUI. The results of the analysis are shown below. There was a blocked state that I hadn’t seen before, and my CUDA API didn’t fully show up. I’d like to see the CUDA HW entry as before, but I’m not sure how to change my Settings. Looking forward to your help!

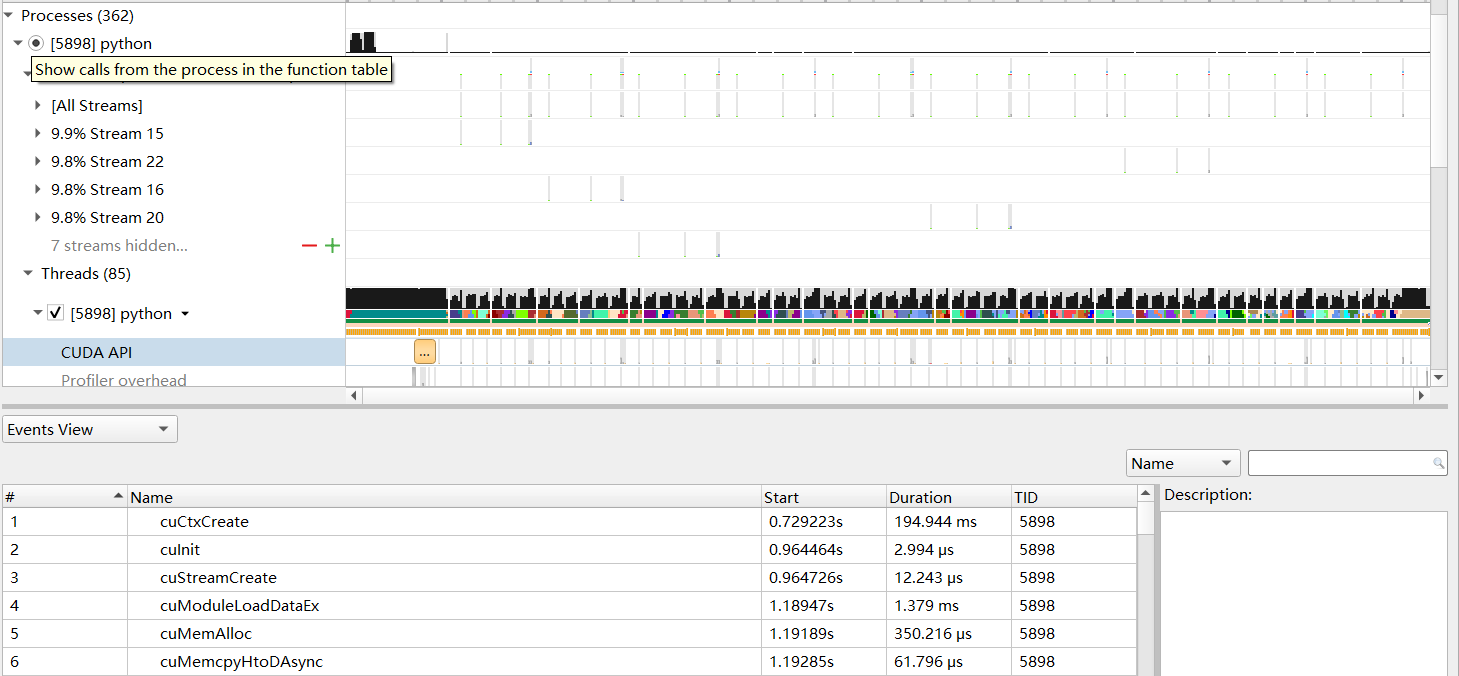
My guess is that the nsight system didn’t fully implement my cuda program, or didn’t fully track the entire program. To do this I looked at my environment variable configuration and used administrator privileges, but it didn’t work.
![]()
What you have highlighted there is the CUDA calls from that particular process, and there look to be other processes/threads going on. I am going to guess that the activity may be elsewhere.
The best way to check would actually be to look at the GPU rows instead of the CPU rows and see where the CUDA kernels were executing there.
Nsight Systems uses the CUPTI library underneath the covers, and CUPTI gets its information directly from the CUDA driver. While we don’t choose to trace small infrastructure kernels (because they have no real user information and are super frequent/high overhead to trace) you should be seeing all of the standard calls and all of your kernels.
Would you be comfortable letting us see the results file?
Report 5.nsys-rep (3.8 MB)
How long would you have expected the application to run? I’m wondering if maybe the trace is only covering the script that launched the work, rather than the process tree. There are no real CUDA kernels being traced here and no CUDA activity showing up on the GPU side.
But I am afraid that I am more on the Linux side than the Windows side, and I am going to have to defer to Doron.