Hi,
May I know if there is a way to measure the RT Core util? like how many or how much percentage of RT Core is used when running OptiX application. I searched through Google but did not find any useful information…
Thank you in advanced!
Hi,
May I know if there is a way to measure the RT Core util? like how many or how much percentage of RT Core is used when running OptiX application. I searched through Google but did not find any useful information…
Thank you in advanced!
Not really. You should be able to profile your own device code with Nsight Compute, but the RT core functionality is included in the results and cannot be singled out.
It’s also not possible to not use them: https://forums.developer.nvidia.com/t/leveraging-rtx-hardware-capabilities-with-optix-7-0/107733
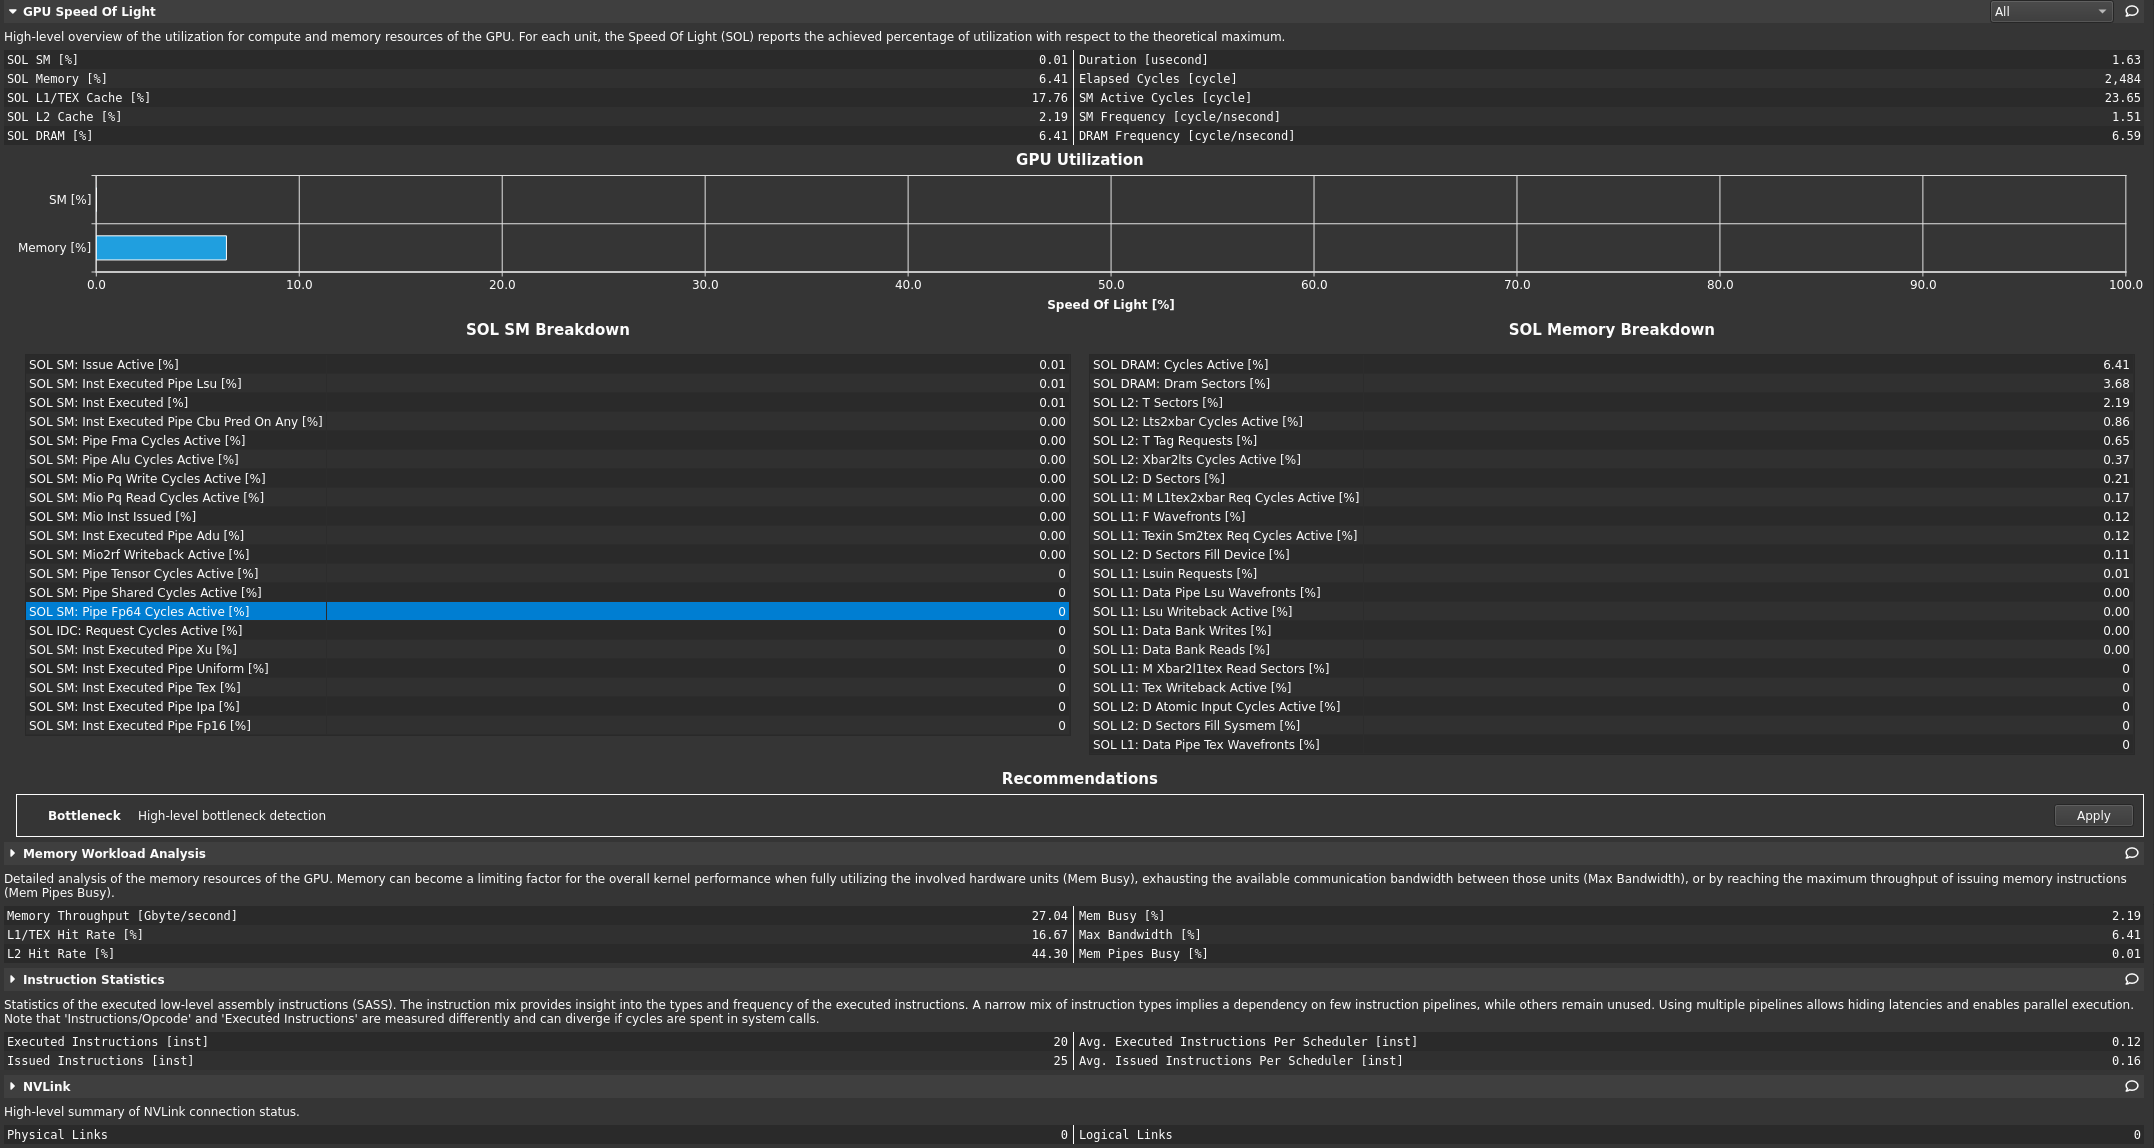
Thank you for your reply! I tried Nsight Compute to profile the sample code optixTriangle and had some further questions.
Nsight Compute will not report RT core usage. Again, you cannot profile the RT cores themselves because you cannot actually program that part. All the OptiX device code you programmed is running on the streaming multiprocessors and that’s what you can see and optimize using Nsight Compute information.
You should look into the Nsight Compute source code view which will show you where it sampled the compute kernel events.
When your OptiX PTX input source code has been compiled with line information and both OptixModuleCompileOptions and OptixPipelineLinkOptions have the debugLevel set to OPTIX_COMPILE_DEBUG_LEVEL_LINEINFO like described here:
https://github.com/NVIDIA/OptiX_Apps/blob/master/apps/rtigo3/src/Device.cpp#L543
https://github.com/NVIDIA/OptiX_Apps/blob/master/apps/rtigo3/src/Device.cpp#L796
then you can see function names and the connection between CUDA source code lines and PTX instructions generated from that.
Important: Note that the OptixModuleCompileOptions optLevel has been left on full optimization. Never profile in debug mode! That will not generate the same PTX code.
Nsight Compute allows collapsing the source code view by function name which will give you an overview which of your device functions took how many of the sampled events. That is the view where you need to start analyzing your own device code for performance.
Again this all shows your streaming multiprocessor code only. Nothing what happens on the RT cores.
You might want to look at the sampled events after an optixTrace() call. If that is showing a lot of events, that would be the streaming multiprocessors waiting on the RT cores.
What you really need to concentrate on is the performance of your device code. The RT cores are able to handle >10 GRays/sec on the high-end boards. You normally reach that only for very simple cases. It’s not a theoretical number.
The limiting factor is what you do inside your device code running on streaming multiprocessors, where memory accesses are normally the bottleneck. Mind that for 10 GRays/sec with a memory bandwidth of 670 GBytes/sec you could only read or write 67 bytes per ray and some of that happens during BVH traversal and ray-triangle intersections already. Concentrate on that and you will gain speed.