I’m trying to profile a python project that uses CUDA (through pytorch) using the GUI (Nvidia Nsight Systems 2024.2.1) on Windows 11. I know the program definitely uses the GPU because I see the GPU usage on the Resource Monitor, and other profiling methods I’ve used that show the CUDA API calls and time spent on the GPU. However I would like to see how occupied my GPU is throughout the run of the program and what kernels are running on it.
My GPU is RTX 2070, Driver Version: 551.61, CUDA Version: 12.4. I do not have sudo permissions on this machine.
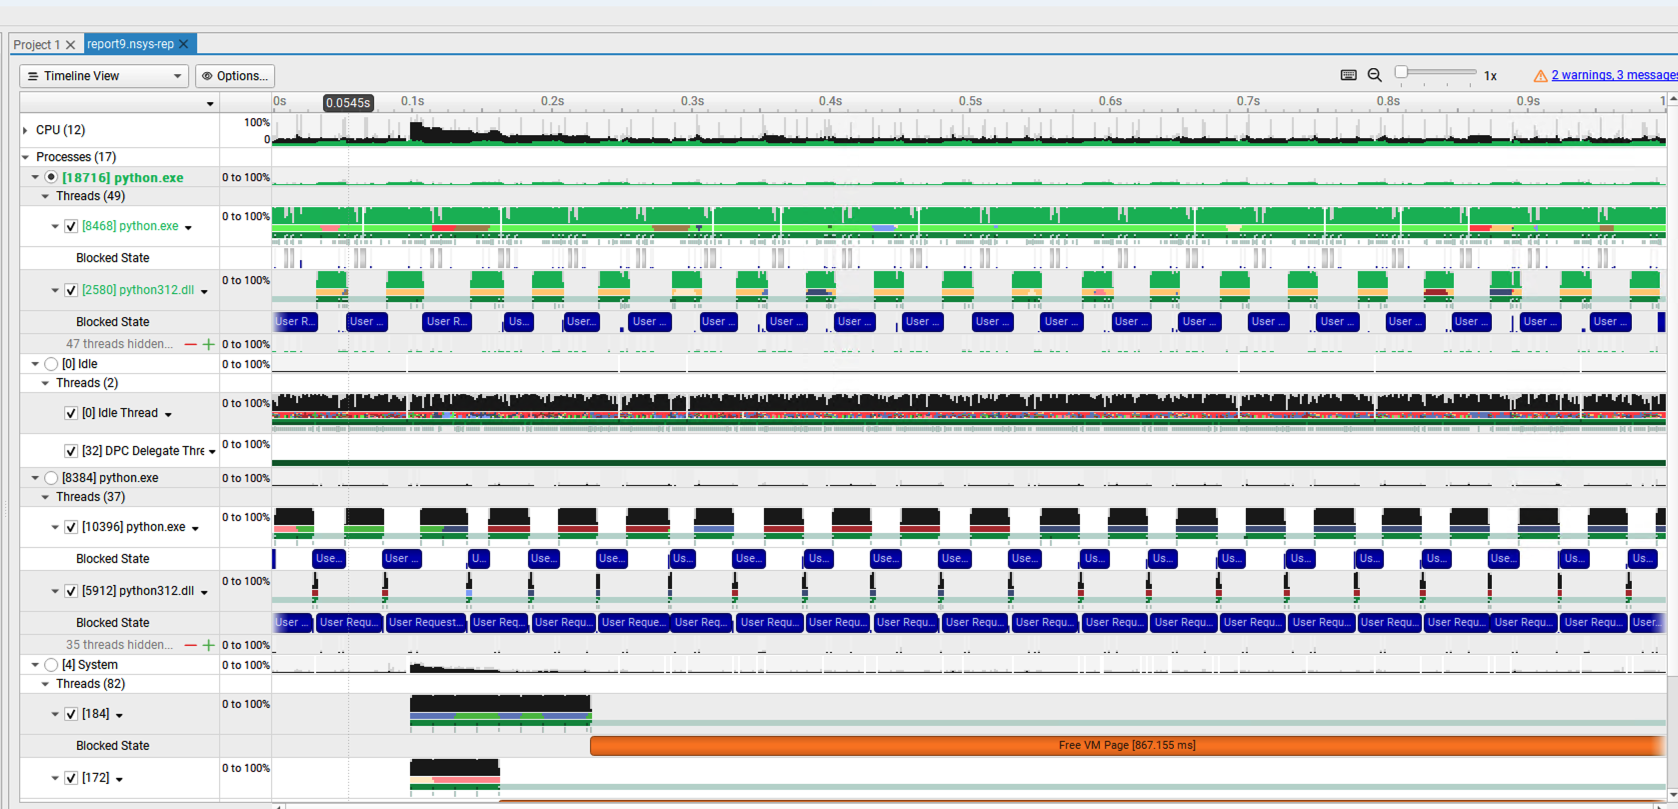
I get these errors in the Diagnostics Summary and am not able to see any GPU traces, only CPU ones.
Warning Analysis 4 00:02.124
CUDA profiling might have not been started correctly.
Warning Analysis 4 00:02.124
No CUDA events collected. Does the process use CUDA?
Summary
I have attached the log file as well. nsys-ui.log (21.9 MB)
@romina.72 Do you mean you can see the CPU-side CUDA API calls, but missing the GPU side kernel activties? Or just not seeing anything related to CUDA at all?
Actually sorry I’m not sure if I can see the CPU-side CUDA API calls, it’s possible I’m not seeing anything related to CUDA at all. I also get the same error for NVTX traces.
I do know the program is using the GPU because I can see the GPU usage go up on nvidia-smi when I run the program.
Just to clarify, do you mean you don’t have Administrator privilege on this Windows system?
AFAIK Nsys CLI requires Administrator privilege, and Nsys GUI will trigger an UAC prompt if you are profiling on a local Window system. I tried locally that if I decline the UAC promot, the target cannot be connected successfully. Did you see the UAC prompt?
Since CUDA and NVTX are both not working, I’m wondering if it’s related to insufficient permission. @ushomroni@dofek Do you know if CUDA and NVTX can work on Windows when user doesn’t have Administrator privilege?
Yes sorry I meant I don’t have administrator privileges. I am using the GUI on a local machine but I did not get a UAC prompt.
I’m wondering if the log I attached earlier shows if permissions are the problem? I suspect they might be as well since there were some “permission denied” messages in the log.
If this is the case is there a way I can still profile my program?
In the log file, I’m not seeing anything from the injection library, so I’m suspecting if Administrator privilege is required to inject the target process on Windows. CUDA and NVTX trace are both based on process injection, so if process injection requires admin permission then they probably won’t work.
I’ve looped in our Windows team to confirm. If that’s the case, they should also be able to suggest if any WAR can be used.