Hi! I am new to Nsight-System and I tried to run some sample commands to understand how it works.
The first thing I did was running on Windows and using SSH to connect the linux server remotely. This part was successful and connected to the server.
Then I tried several commands like: ls, cd ./xxx, top, ll, etc.
But only ls command works and all the rest gave similar error log like below
Hi, let’s make sure I understand what you were doing.
You launched the GUI on Windows, and from the GUI told it you wanted to run a profile on your linux box? And then you told it the application you wanted to launch was a standard Linux tool like top?
I wonder if it is the case that “the application running actually ended before the tool could find any profiling data”, would there ba any other commands that I can try to make the tool find any profiling data? Or should I actually run a training program or maybe a small demo can do?
Thank you very much for your reply! Yes that is the problem!
After I changed the paranoid value from 1 to 2. All other commands have worked!
However, I want to dig more on this tool, because all my codes were actually running in docker. So, I wonder if it is possible that I can track the program that is running on docker? If possible, then that would be truely helpful!
Hi sorry about the late reply, I did try to follow the Documentation to test it in my container, and it did worked!! Thank you very much for your help!!
Then I got the profile document back like below:
The entire program was itering a resnet50 model doing classification on an image 1000 times.
I think it works fine, but the diagram seems not quite readable. The first time I saw this software was from a TensorRT presentation given by Tencent. During the presentation they showed the entire running prcess like below:
which has blocks with labels on and telling what does each part did. I wonder if it is a hidden function that I didn’t use it correctly or it is achived by using external supports?
I would be appreciate if you can help.
And BTW, thanks for all the replies you gave!
You’ll need to zoom in, a lot. I recommend CTRL and the scroll wheel on your mouse as the most effective way to zoom in. When you scroll in, as there is enough space on-screen, the underlying kernels will become big enough to display text. You can also mouse over kernels to get information, but I find it clearer to just scroll a long way in. You are showing 8 seconds of time in your screen shot…there isn’t a time indicator on the one from the presentation, but I bet it is less.
You’ll need to open the process and find the GPU associated with the activity. Then open that GPU. The screen shot you are showing on the bottom is looking inside a particular CPU to see where the items that were annotated with NVTX are showing up.
(and of course, you will want to have NVTX trace turned on, which I assume you do, as it is usually on by default, but I can’t actually see from your screenshot if it is).
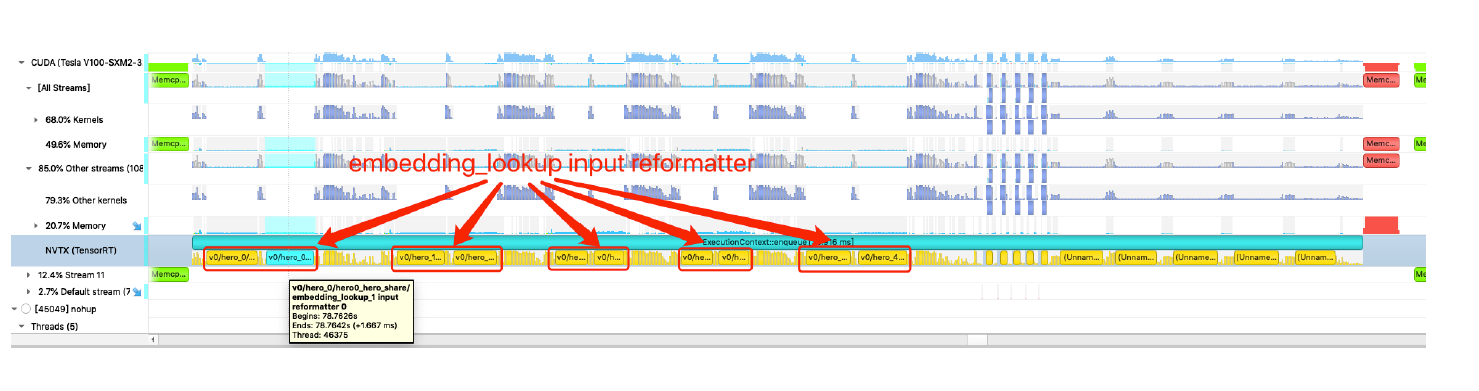
This run did not have NVTX, but you can see that I drilled down to ~16 ms of time, that information about the GPU activity (memory transfers) is starting to show up, and that mouse-overing reveals more information:
Hi, that is exactly what I am looking for!! Thank you so much!
I will check it back on Monday because it was running on the server of the company.
Really appreciate for the detailed explanation and screenshot. And now I think I am ready to use it on my project!