I am profiling a CUDA program on WSL using nsys, but the profiling file seems to have no trace of CUDA kernel calls. An example is provided below:
I firstly write a simple cuda program, test.cu:
#include <iostream>

__global__ void test(int* a){
	int idx = blockIdx.x * blockDim.x + threadIdx.x;
	++a[idx];
}

int main(){
	int* arr;
	cudaMalloc(&arr, sizeof(arr[0]) * 10);
	cudaMemset(arr, 0, sizeof(arr[0]) * 10);
	test<<<10,1>>>(arr);
	int arr_res[10];
	cudaMemcpy(arr_res, arr, sizeof(arr[0]) * 10, cudaMemcpyDeviceToHost);
	for(int i=0; i<10; ++i){
		if(arr_res[i] != 1) std::cout << i << ':' << arr_res[i] << std::endl;
	}
	return 0;
}
then I compile and profile it in my WSL using nvcc test.cu -o test && nsys profile ./test, and opened the generated report1.nsys-rep in Nsight System in Windows:
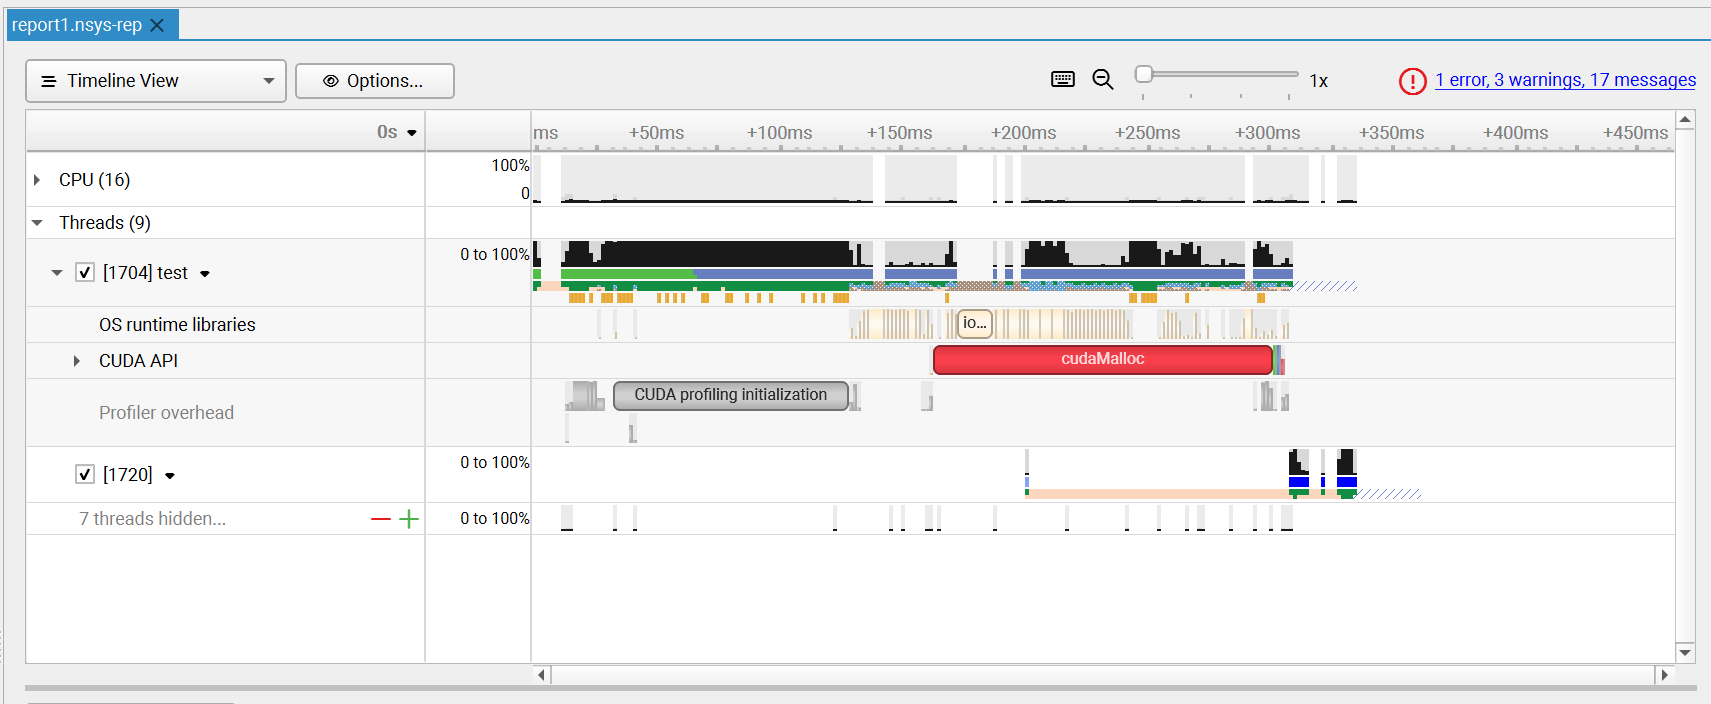
It does not show the GPU (kernel calls) and warns me that there is an error:

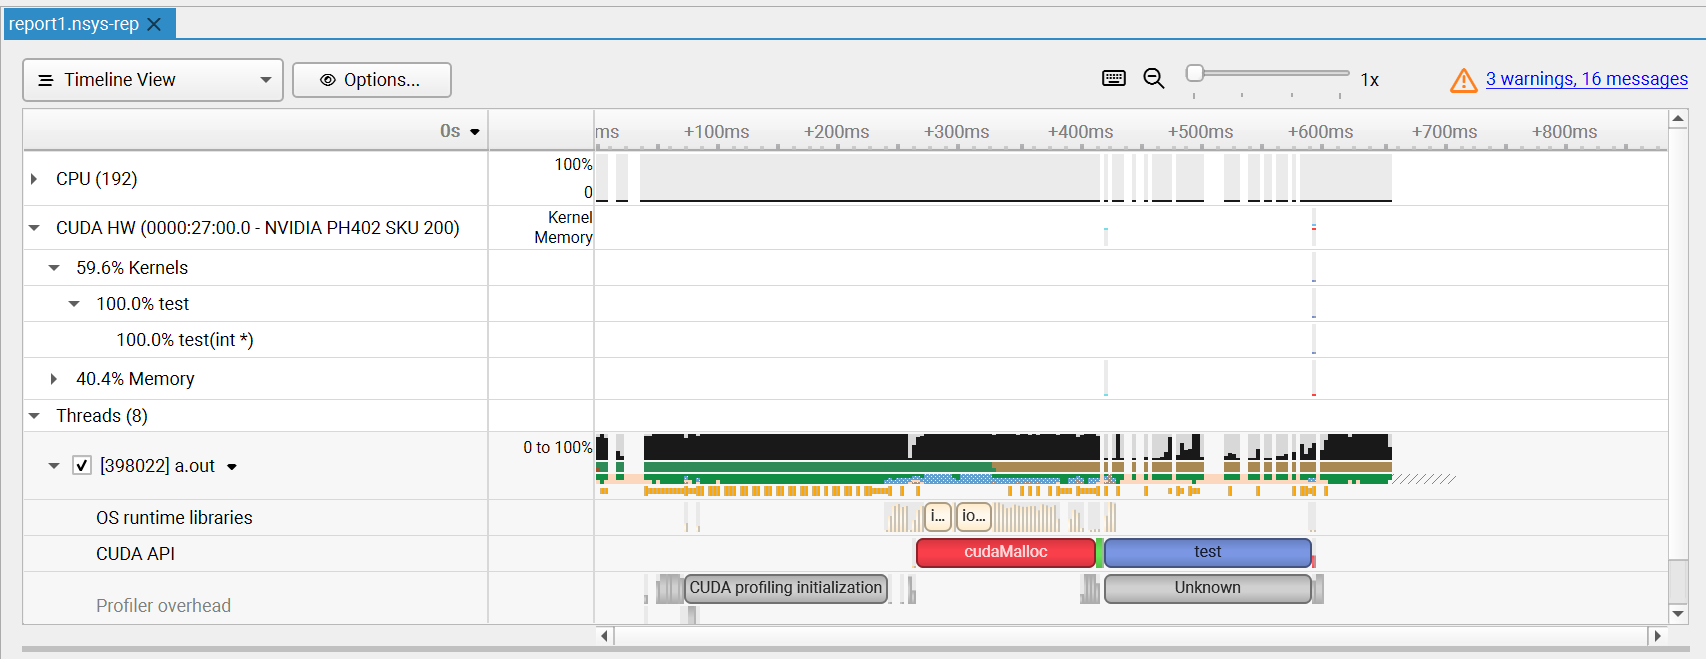
However, I reproduced the whole procedure on another linux server, and it does trace kernel executions and shows no error at all:
So how can I get kernel execution traces in WSL?
Version information:
- The WSL server has a Nvidia GeForce RTX 3090 Ti GPU
- The WSL server has WSL2 with distribution
Ubuntu 20.02 - The WSL server has
cuda-toolkitsinstalled andnvcchas version12.6.85 - The nsys on the WSL server has version
2024.5.1.113-245134619542v0 - The
Nsight Systemson windows has version2024.7.1
P.S. Since I am quite new with CUDA programming, I am not sure how to debug this, and are willing to provide necessary files/command outputs/results if needed.