NSIGHT - Unable to initiate WebGL 2 in Chrome when invoked through Frame Debugger

Hi Forum members & Admins,

NSIGHT Frame debugger is a great application that I use very often to sort out issues in my OpenGL programs.

Recently, I had intended to look at my WebGL program and had then configured Chrome (Version 135.0.7049.115 (Official Build) (64-bit))

I used it with command line arguments as mentioned in here

I was successfully using Frame debugger to track my WebGL 2 application.

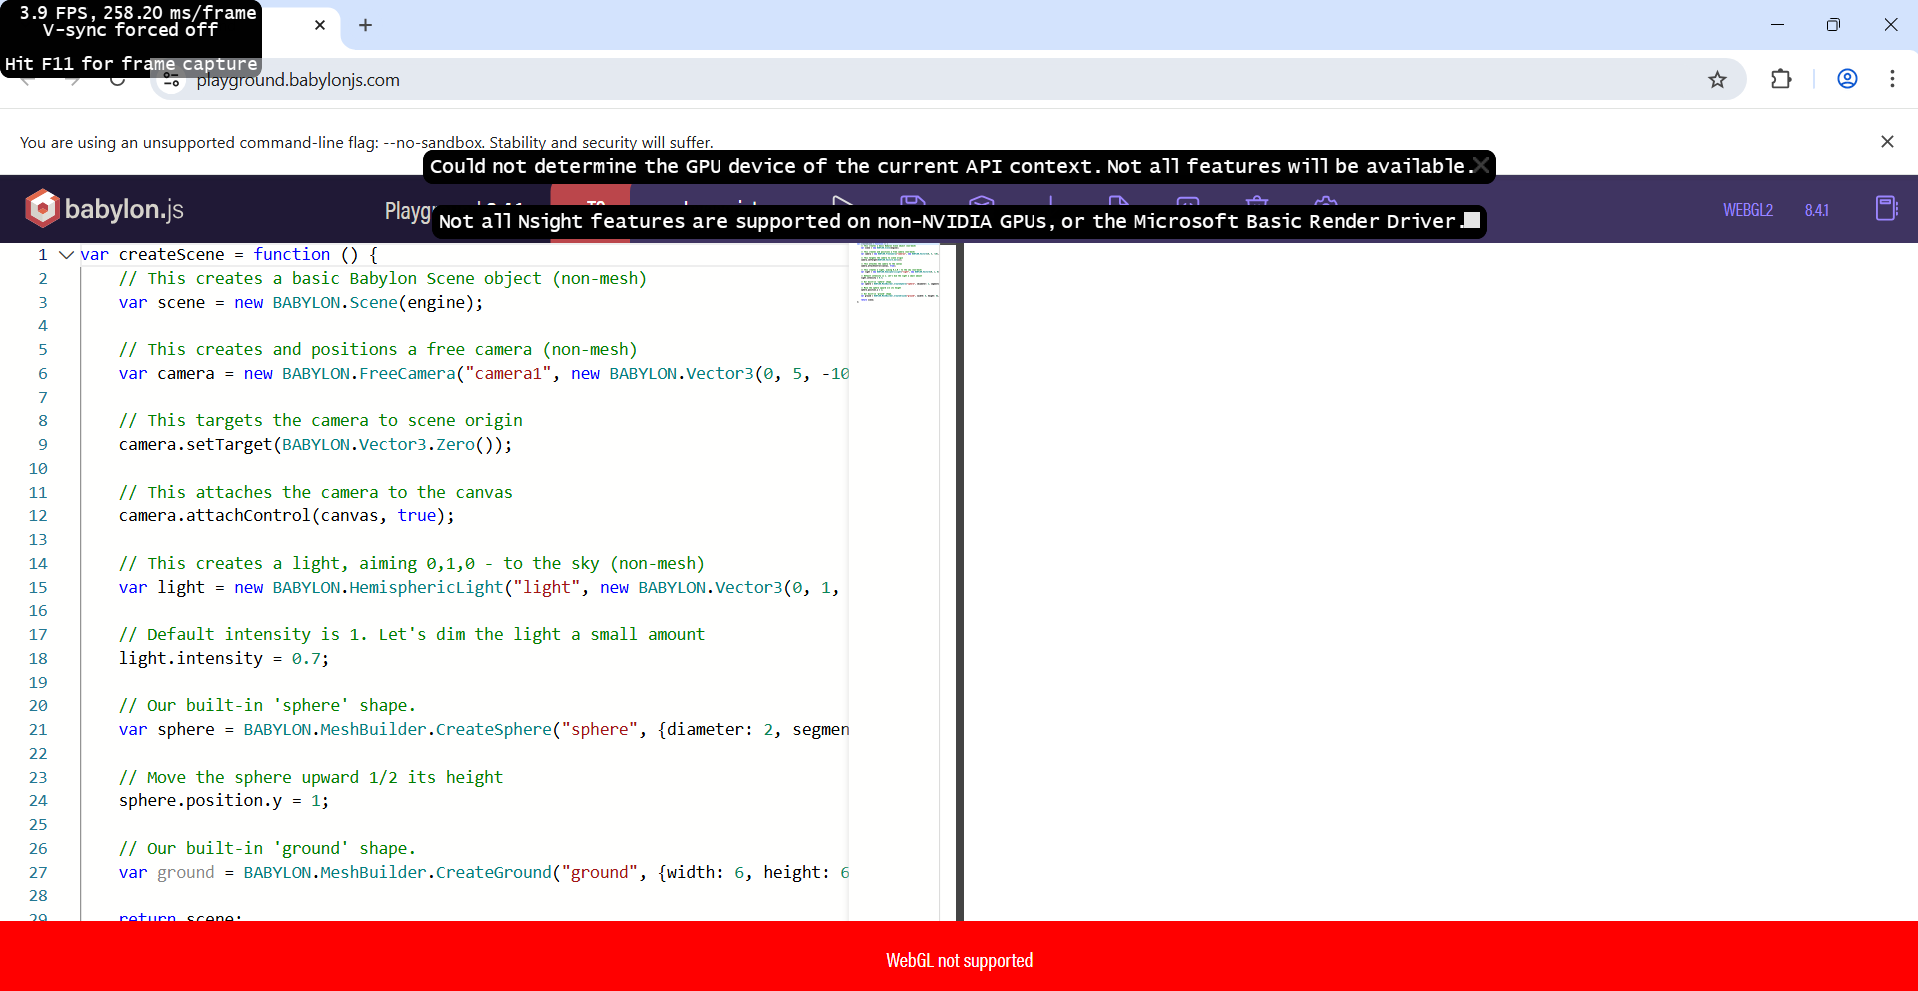
But, after few instances of successfully running the Frame Debugger, the launch of Chrome from Frame debugger is causing Chrome to run using Microsoft Basic Render Driver. In this mode, WebGL isn’t available and I’m unable to proceed any further.

I guess, may be browser / app had crashed once and is not able to recover properly.

When Chrome is invoked normally, WebGL is working fine without any issues. Problem of MS Basic Render Driver occurs only when invoked through Frame Debugger launch process.

Any idea on what could have happened. Could I check any Chrome / NSIGHT crash log to find the cause?

Is there any additional Chrome or NSIGHT settings / flags that I need to reset?
Please help to resolve this failure. Thanks in advance.

Machine Details:
NVIDIA T1200 Laptop GPU
Windows 11 Pro
Application: NVIDIA Nsight Graphics
Version: 2025.1.0.0 (build 35447848) (public-release)

Launch Parameters:

Executable: “C:\Program Files\Google\Chrome\Application\chrome.exe”

Command Line Arguments:
–no-sandbox --disable-gpu-watchdog --disable-features=RendererCodeIntegrity --gpu-startup-dialog -disable-gpu-program-cache “https://playground.babylonjs.com

Chrome flag - ANGLE backend is set to OpenGL

Failure messages shown in Chrome browser

Hi cceanand,

Thank you for using Nsight Graphics and providing your feedback. I tried the similar command line as yours, but I don’t see the warning about ‘Not all Nsight features are supported on non-NVIDIA GPUS, or the Microsoft Basic Render Driver’. From your context, this doesn’t look like an issue of Nsight Graphics.

Maybe you can try these:

  • Reinstall the driver
  • Make sure Chrome process is killed properly before you launch it through Nsight Graphics
  • Reinstall Chrome or reset Chrome
  • If you are using a laptop with both iGPU and dGPU (Nvidia GPU), try to force the Chrome.exe to use dGPU under NVIDIA Control Panel → Manage 3D settings.

Thanks
An

Does rebooting get things back into the expected state? If so, it may be worth experimenting with different driver versions to see if one doesn’t have this issue.

Hi An & JonL,

Sorry, I didn’t check this post for many days.

Yes, I tried reinstalling driver, killed all chrome processes, reinstalled Chrome and forced Chrome to use NVIDIA using NVIDIA Control Panel. But nothing worked for Frame debugging. It still kept showing the above error.

Later, I found a workaround. In Windows 11 Graphics setting for Chrome’s GPU Preference, I set it to use NVIDIA GPU instead of allowing Windows to decide.

On setting this option, NSIGHT Frame Debugger is working fine. Chrome doesn’t switch to Basic drivers while invoking it through NSIGHT.

But the problem is Chrome encounters a lot of flickers with this option set. So, only while I’m Frame Debugging, I go and set this Windows option and then revert it back to Intel card for regular Chrome usage.

This topic was automatically closed 14 days after the last reply. New replies are no longer allowed.