I’m attempting to use Nsight Graphics 2023.3.2 with Chrome 119 on Ubuntu 22.04, to debug WebGL applications. Despite trying launching Chrome with the flags mentioned by the documentation, I’m still left in the “Searching for attachable process 88351 on local socket…” state forever. I’ve confirmed ANGLE is set to use OpenGL, and I’ve made sure no existing Chrome processes are running.
Can you confirm that Nsight Graphics 2023.3.2 is able to launch Chrome? And if so, what flags/settings are necessary?
Thanks for the reply, and I look forward to any update on this isse when you know more.
In the meantime I’ve tested this on Windows. I’m able to use the Frame Debugger, but no luck with GPU Trace Profiler, which is what I originally wanted to run.
The setup I’m using is:
Running Nsight Graphics 2023.3.2 as Administrator
Executable: C:/Program Files (x86)/Google/Chrome/Application/chrome.exe
Arguments: --no-sandbox --disable-gpu-watchdog --gpu-startup-dialog
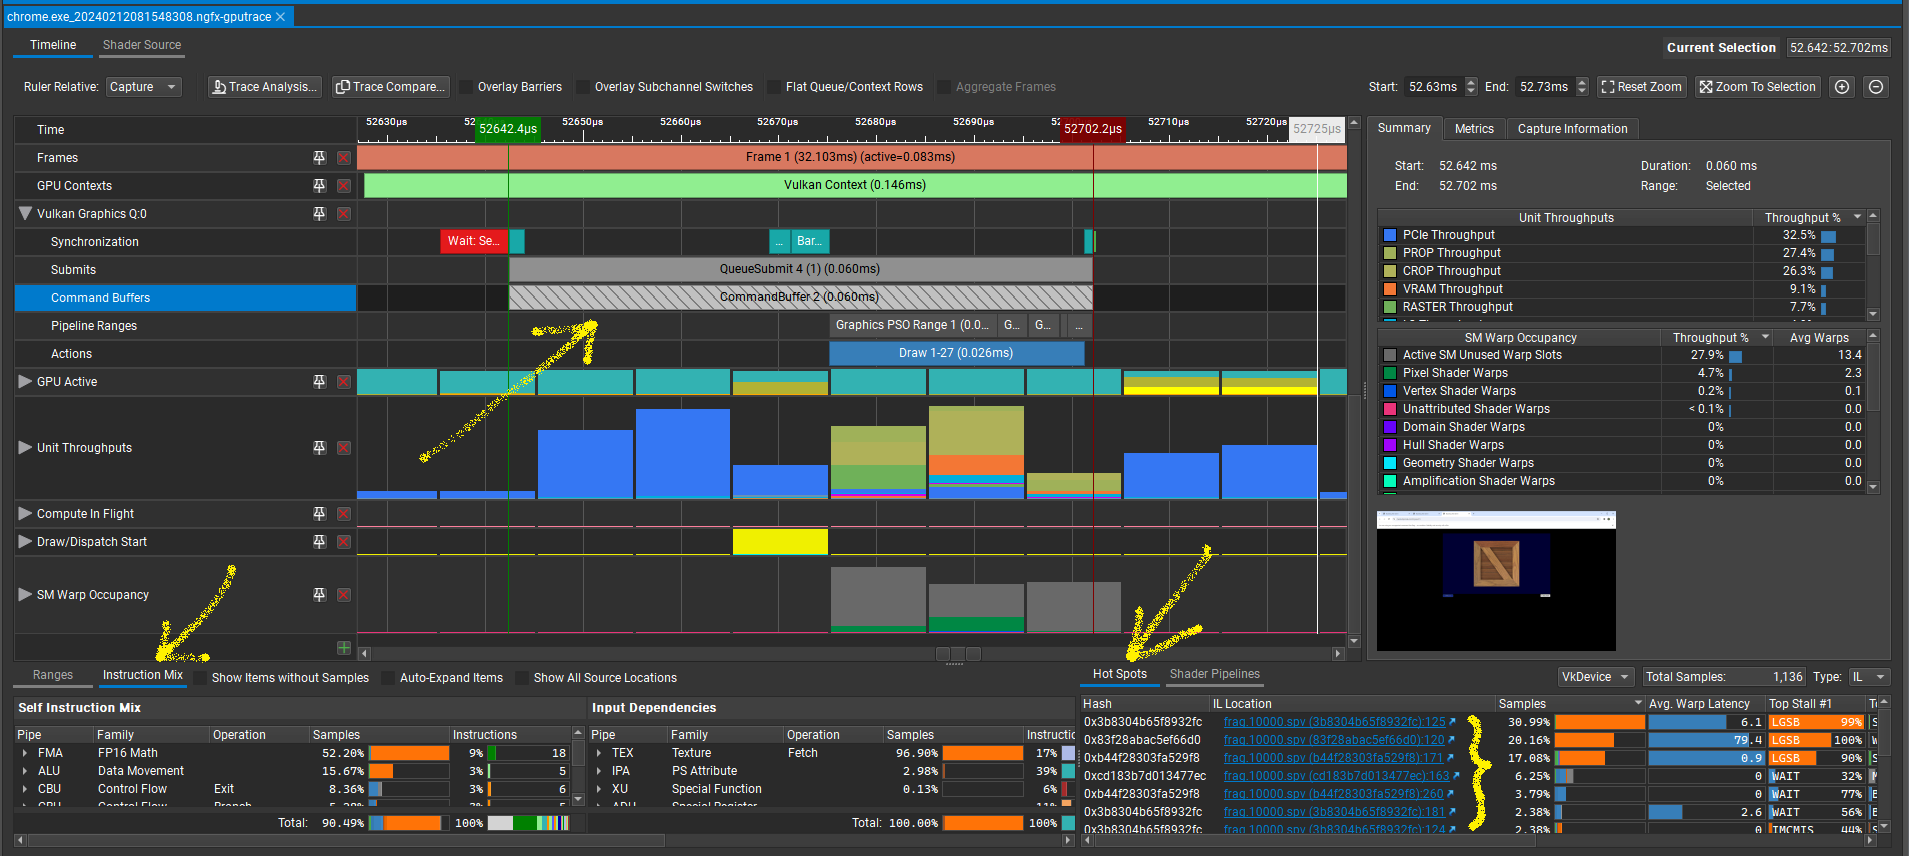
Activity: GPU Trace Profiler with default parameters. Using Turing (RTX 2080 Ti).
Windows 10
Chrome 119
NVIDIA Driver 546.17
Launching and attaching works fine, but the “Generate GPU Trace Capture” button is greyed out. After about 20 seconds, it sometimes turns white (clickable), but when clicking it, I’m presented with a “Capture Error: No data source is available - Make sure the application is using a supported API”. I’m running Chrome with the ANGLE backend set to OpenGL, and I’ve confirmed this is indeed the case using chrome://gpu.
Oh, Sorry that I miss checked your Nsight Version, you are using the latest Nsight which supports OpenGL, I need to be more careful before I click send.
I still need some time to check your question. Sorry.
Is there any progress on the internal issue you created for using Chrome/WebGL on Linux? I just tested the newest release (2023.4.1.0), but it seems to suffer from the same issues.
PS: The first time I tried with 2023.4.1, the HUD never got past “Initializing”. I’m guessing this was due to having multiple tabs open. As a friendly suggestion, you may want to create a separate “chrome profile” for testing that doesn’t restore existing tabs, and/or use a separate chrome installation for testing.
I should note, the results above were on Windows. We’ll try out Linux next.
The GL backend for angle did not work under GPU Trace in my testing.
For now, Vulkan is your best bet. Vulkan provides another major advantage – availability of the Real Time Shader Profiler. The following is also from your website.
To make the best use of this, compile your shaders with debug symbols.
I just tried using the Vulkan backend for angle on Linux (Ubuntu 22.04), using these exact flags (and a large number of other combinations of flags), but no luck so far. I’d be very interested to hear any findings you come up with!
While I could (and probably will) try this on Windows, I have very different hardware on that machine, so the results will not be very valuable.
Yes, we tried both Frame Debugger and GPUTrace on Linux for Vulkan backend, there are still some issues there. We already update that to the internal tracking case.
Hi! I can confirm that this is still an issue with the new version (2024.1.0).
I’ve experimented with different Chrome flags, and without the --disable-gpu-sandbox flag Chrome always outputs ...ERROR:gpu_process_host.cc(991)] GPU process launch failed: error_code=1002, which sounds bad. If I include this flag, the (relevant) output from Chrome is:
eirik@hp-zbook:/opt/nvidia/nsight-graphics-for-linux/nsight-graphics-for-linux-2024.1.0.0/host/linux-desktop-nomad-x64$ ./ngfx-ui
[19450:19450:0402/090919.994989:ERROR:gl_display.cc(767)] ANGLE Platform initialization failed.
[19450:19450:0402/090920.370112:ERROR:gl_context_egl.cc(523)] eglMakeCurrent failed with error EGL_SUCCESS
[19450:19450:0402/090920.370182:ERROR:gl_context_egl.cc(406)] eglDestroyContext failed with error EGL_SUCCESS
[19450:19450:0402/090920.402297:ERROR:gl_context_egl.cc(523)] eglMakeCurrent failed with error EGL_SUCCESS
[19450:19450:0402/090920.402321:ERROR:gpu_info_collector.cc(104)] gl::GLContext::MakeCurrent() failed
[19450:19450:0402/090920.402330:ERROR:gl_context_egl.cc(406)] eglDestroyContext failed with error EGL_SUCCESS
[19450:19450:0402/090920.402335:ERROR:gpu_info_collector.cc(588)] Could not create context for info collection.
[19450:19450:0402/090920.402361:ERROR:gpu_init.cc(103)] CollectGraphicsInfo failed.
[19450:19450:0402/090920.406596:ERROR:viz_main_impl.cc(198)] Exiting GPU process due to errors during initialization
Not sure what to make of this. If I go to chrome://gpu after it launches, it says “Software only. Hardware acceleration disabled”. Adding the --use-angle=vulkan does not change this, or any of the output from Chrome.
If I include the --no-sandbox flag, the output is the same, but Chrome launches with all tabs in the “crashed”- state.
Is there any troubleshooting I can do on my end to help get this working?
Nsight can launch Chrome with Frame Debugger and GPUTrace activity smoothly in Linux during our test, no matter you choose --use-angle=vulkan or --use-angle=gl.
The log looks different and it’s weird that Chrome says “Software only. Hardware acceleration disabled”, can you check that your driver is installed properly in your Linux?
Could you share the exact version of Chrome, as well as which NVIDIA driver and OS version you managed to run GPU Trace on? I’ll compare and potentially (re)install to match that. I’m assuming you’re using Nsight Graphics 2024.1.0 ?
The test was done several weeks ago, I am not sure the Chome was updated or not. The driver is some internal driver (may not released yet, sorry that I can’t share that with you). The OS is Ubuntu 2204.